Municipal Maps of Compliance and Non-compliance with Labor Conditions in Mexico

Maps
-
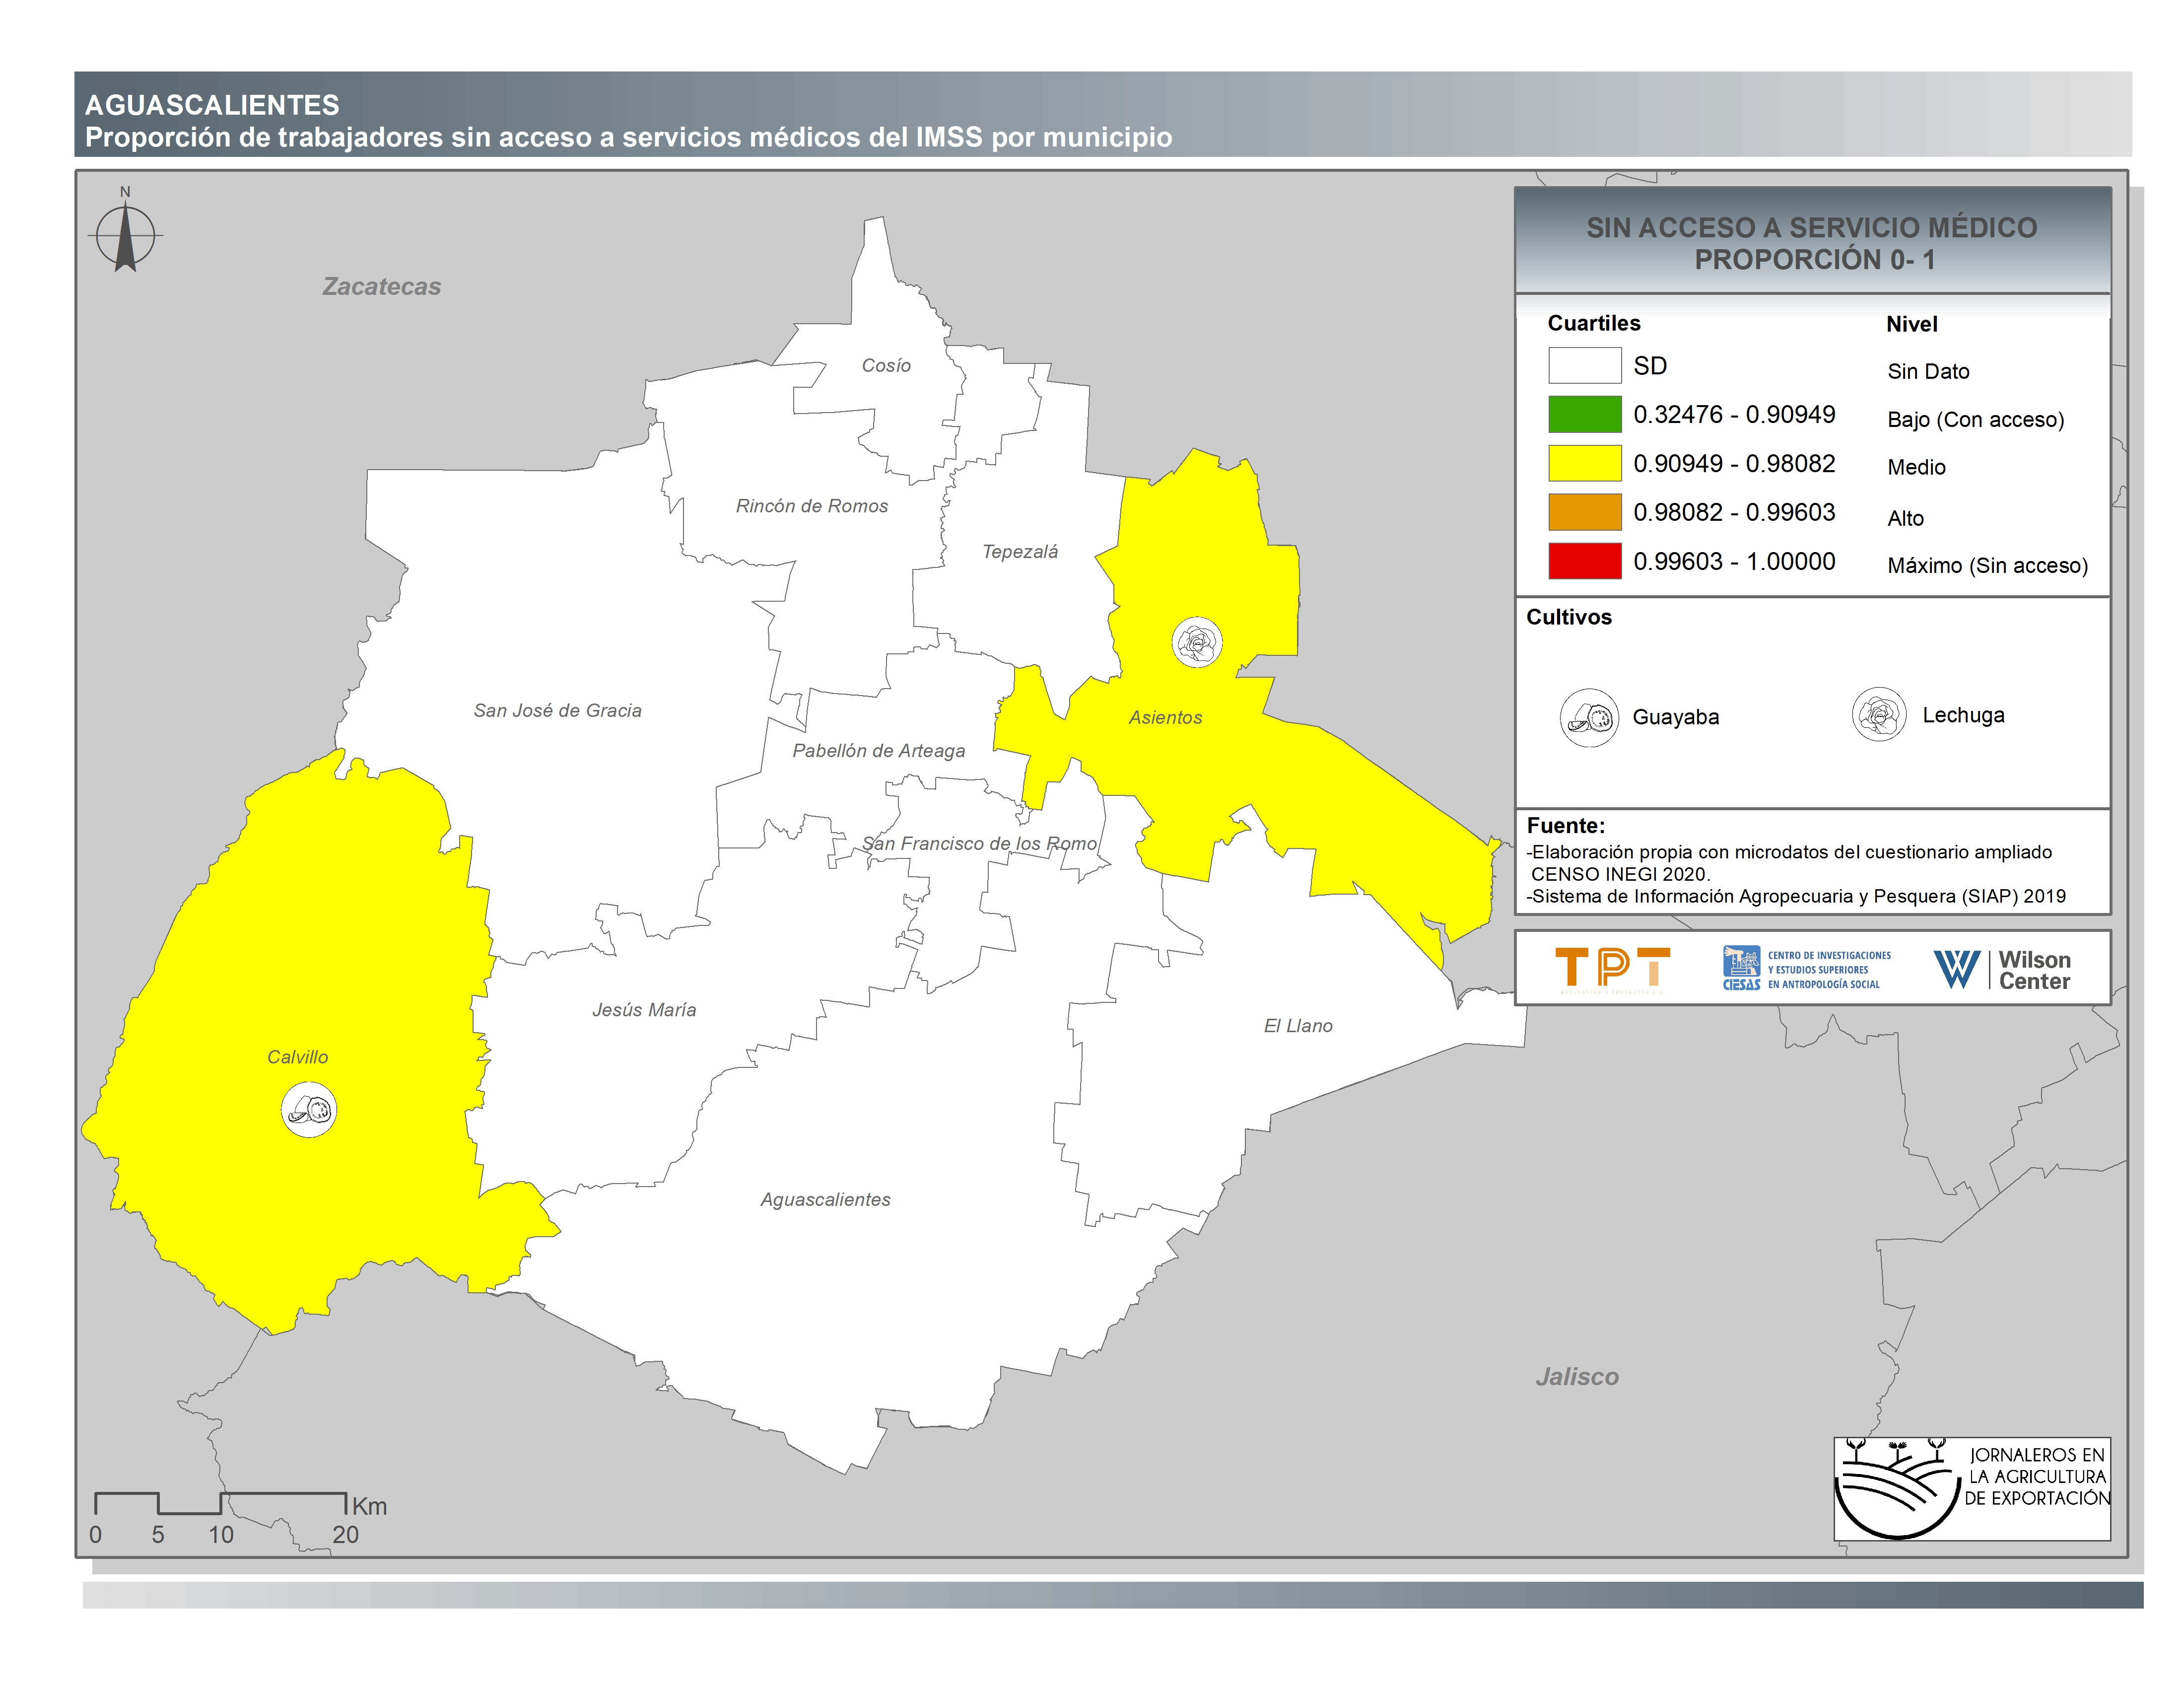
Aguascalientes
-
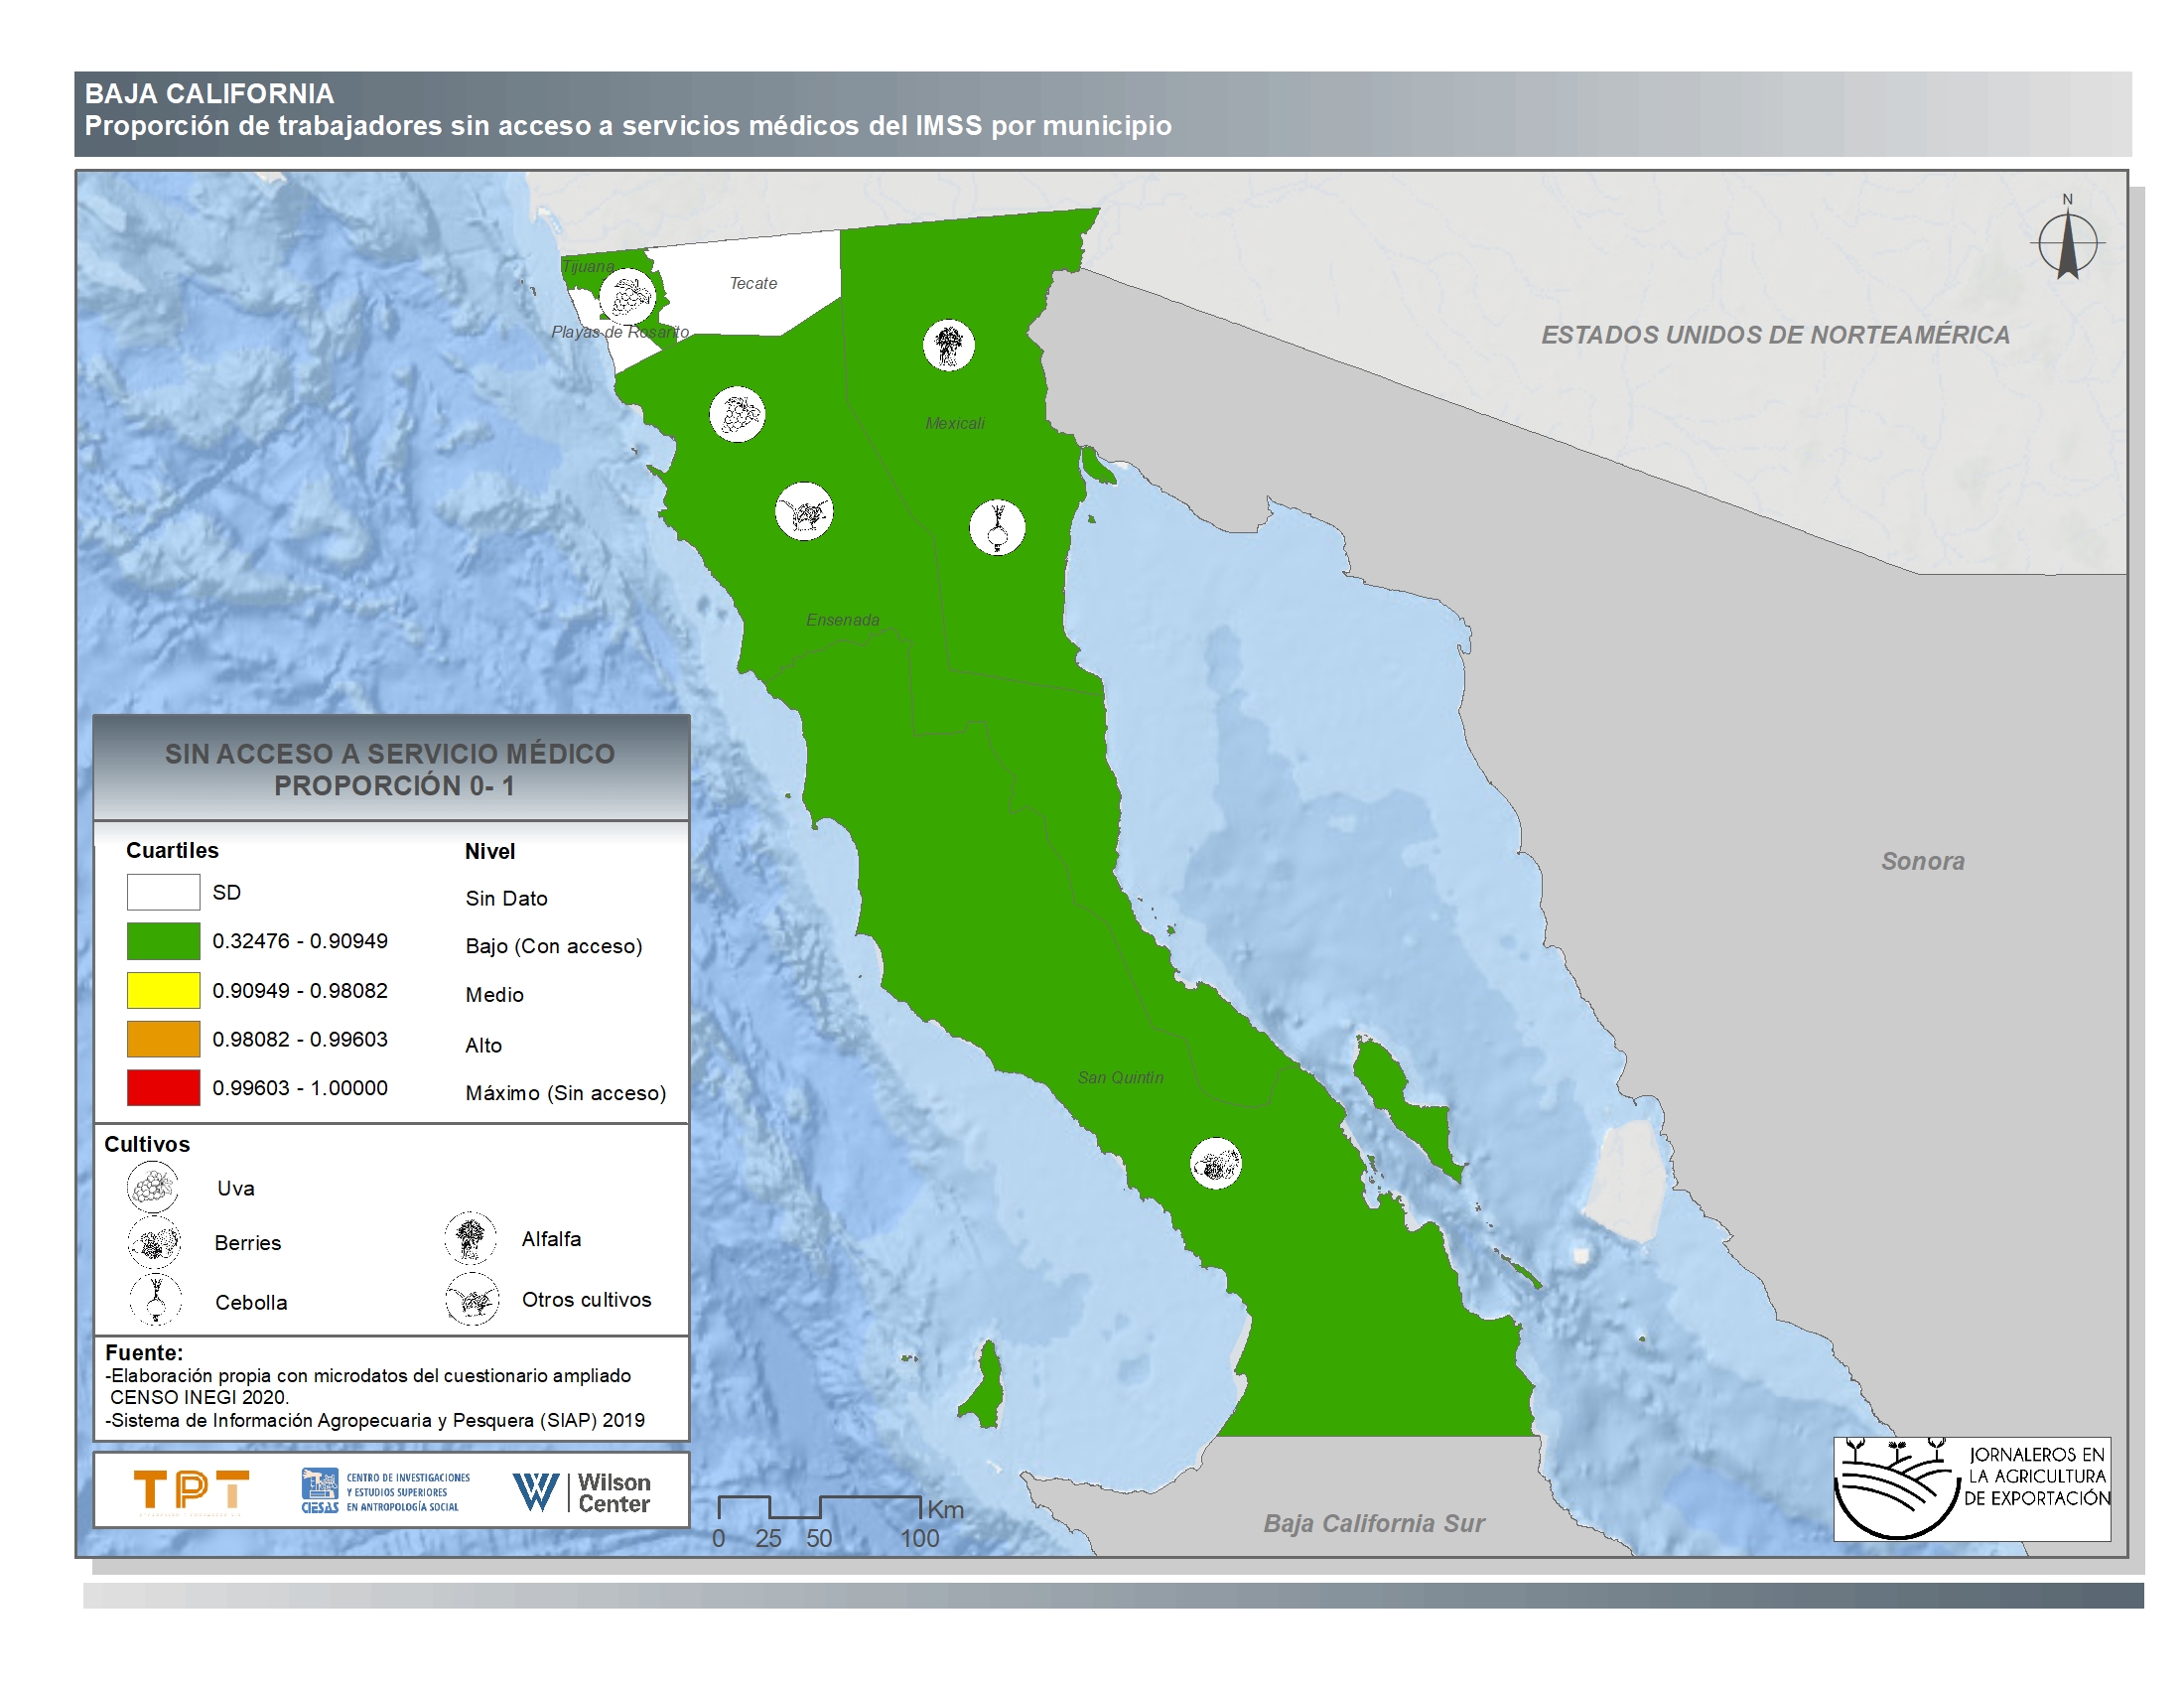
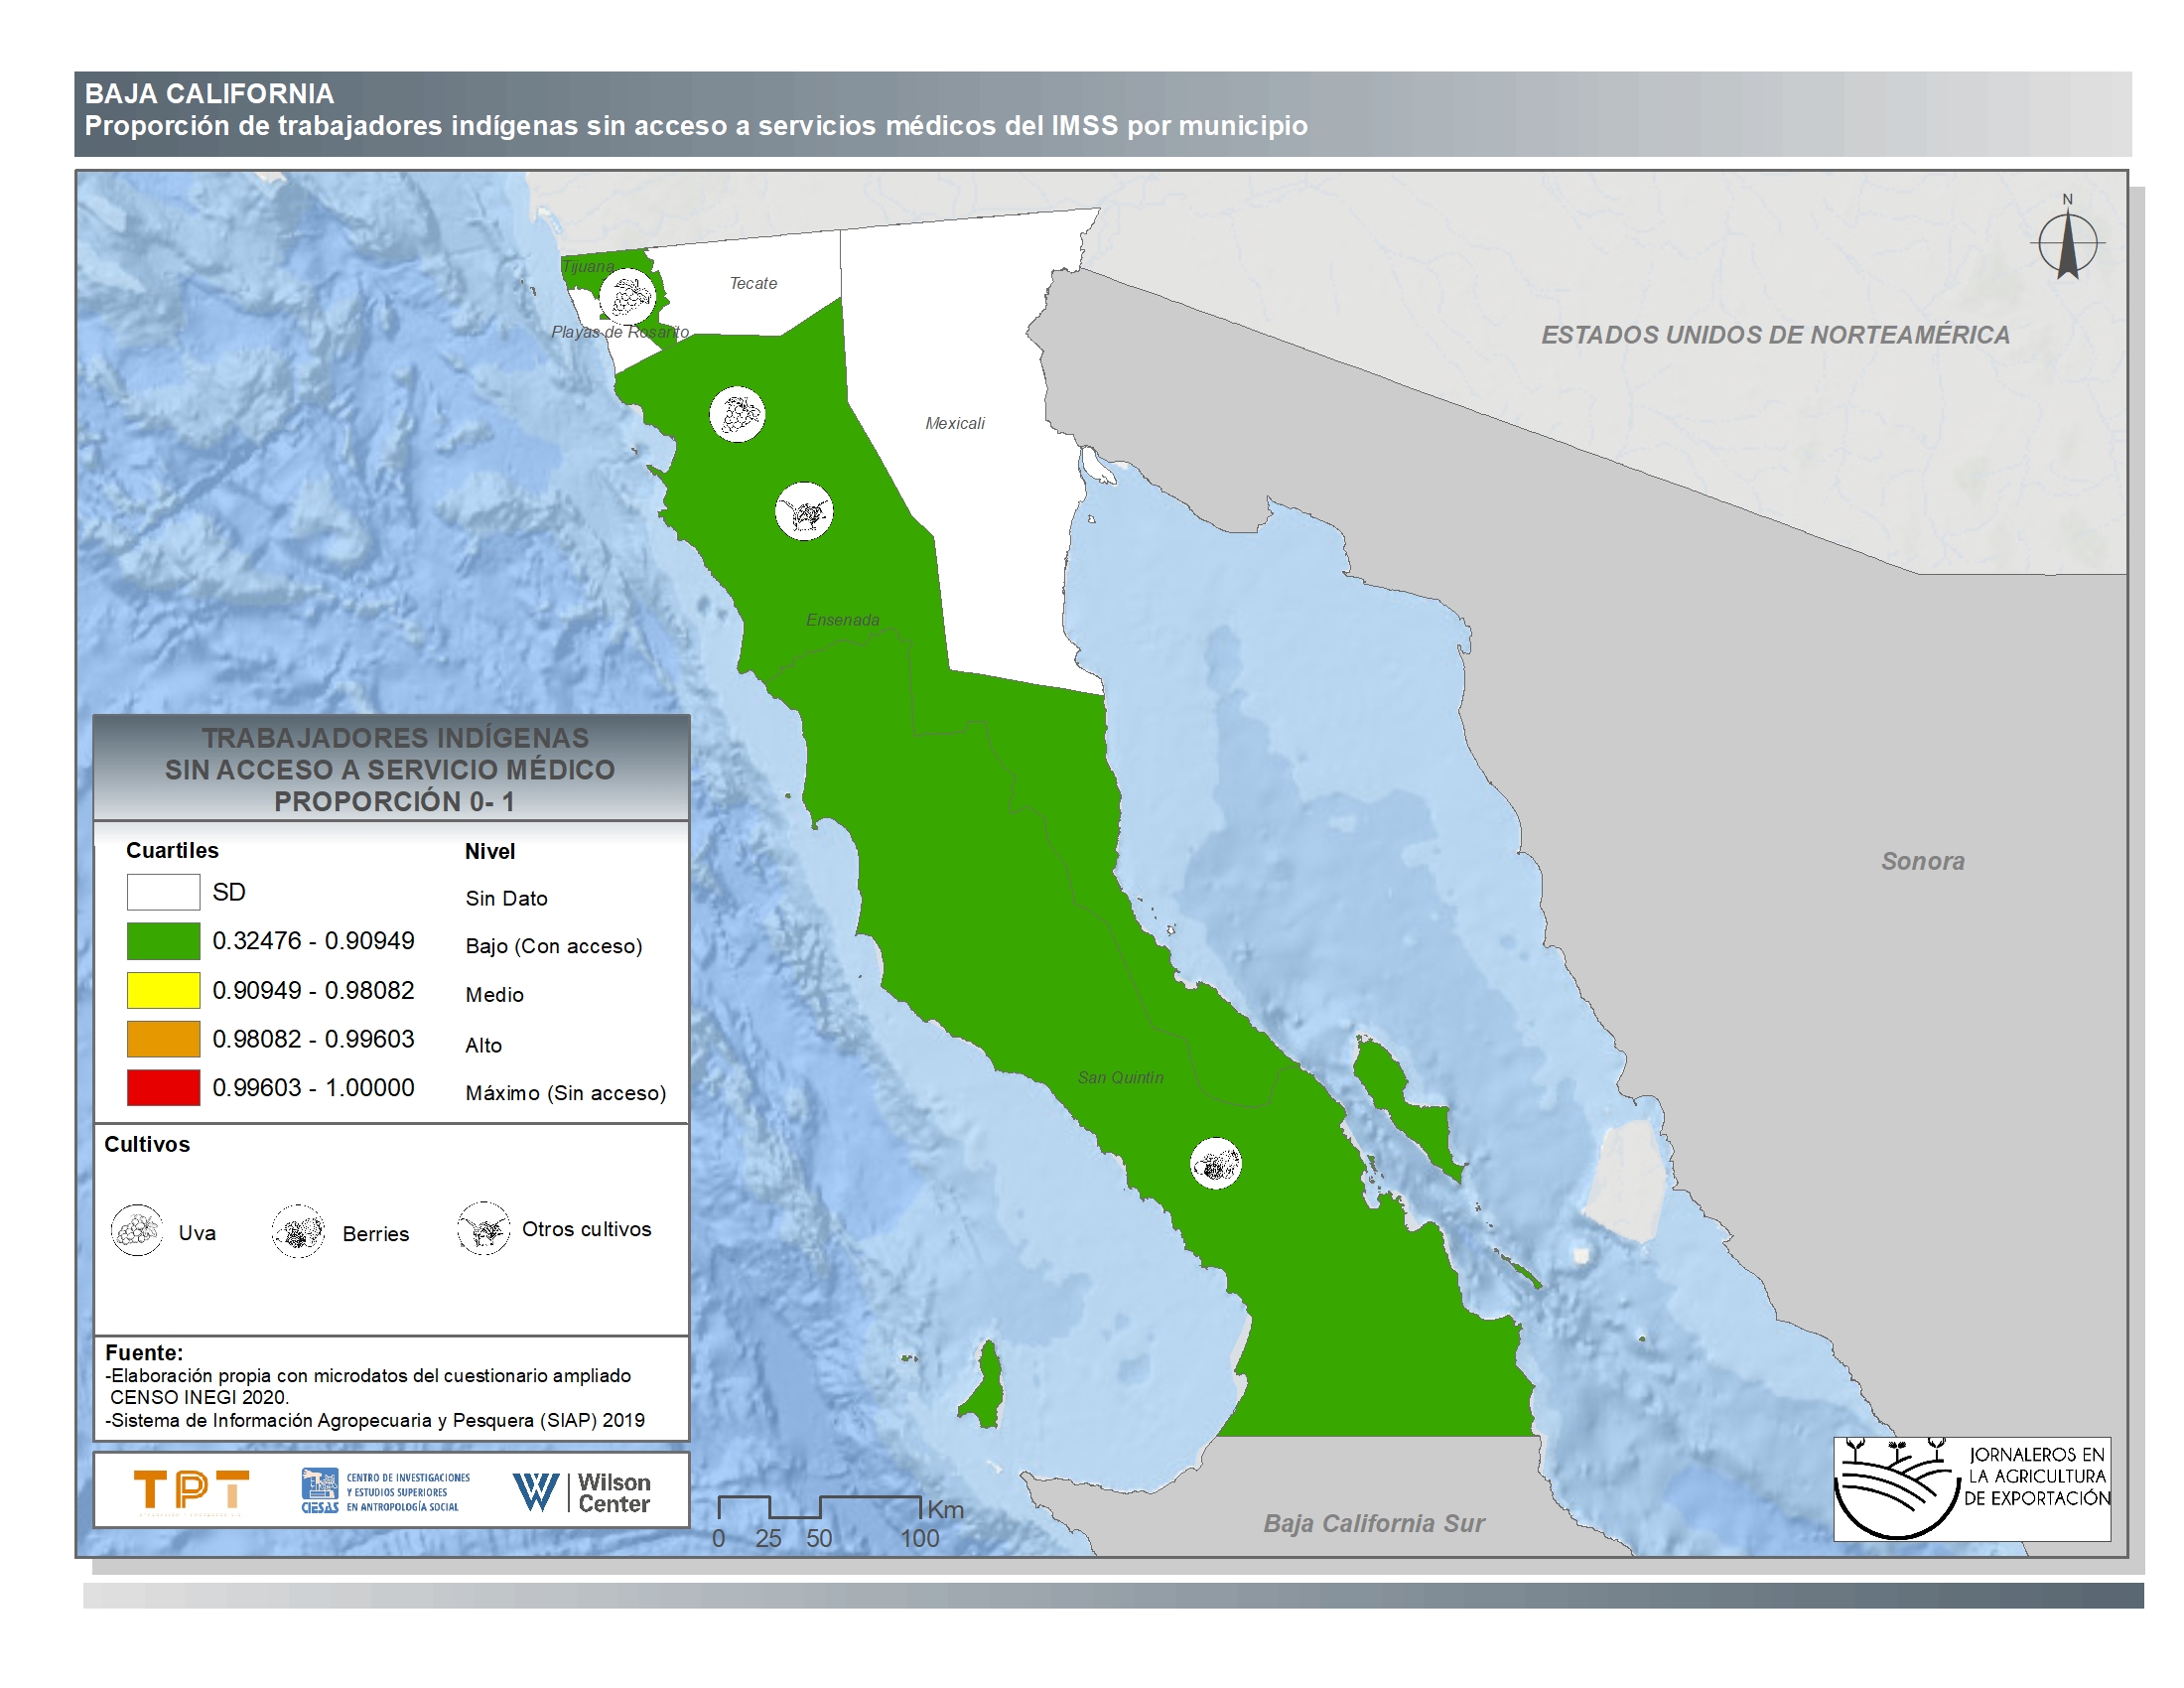
Baja California
-
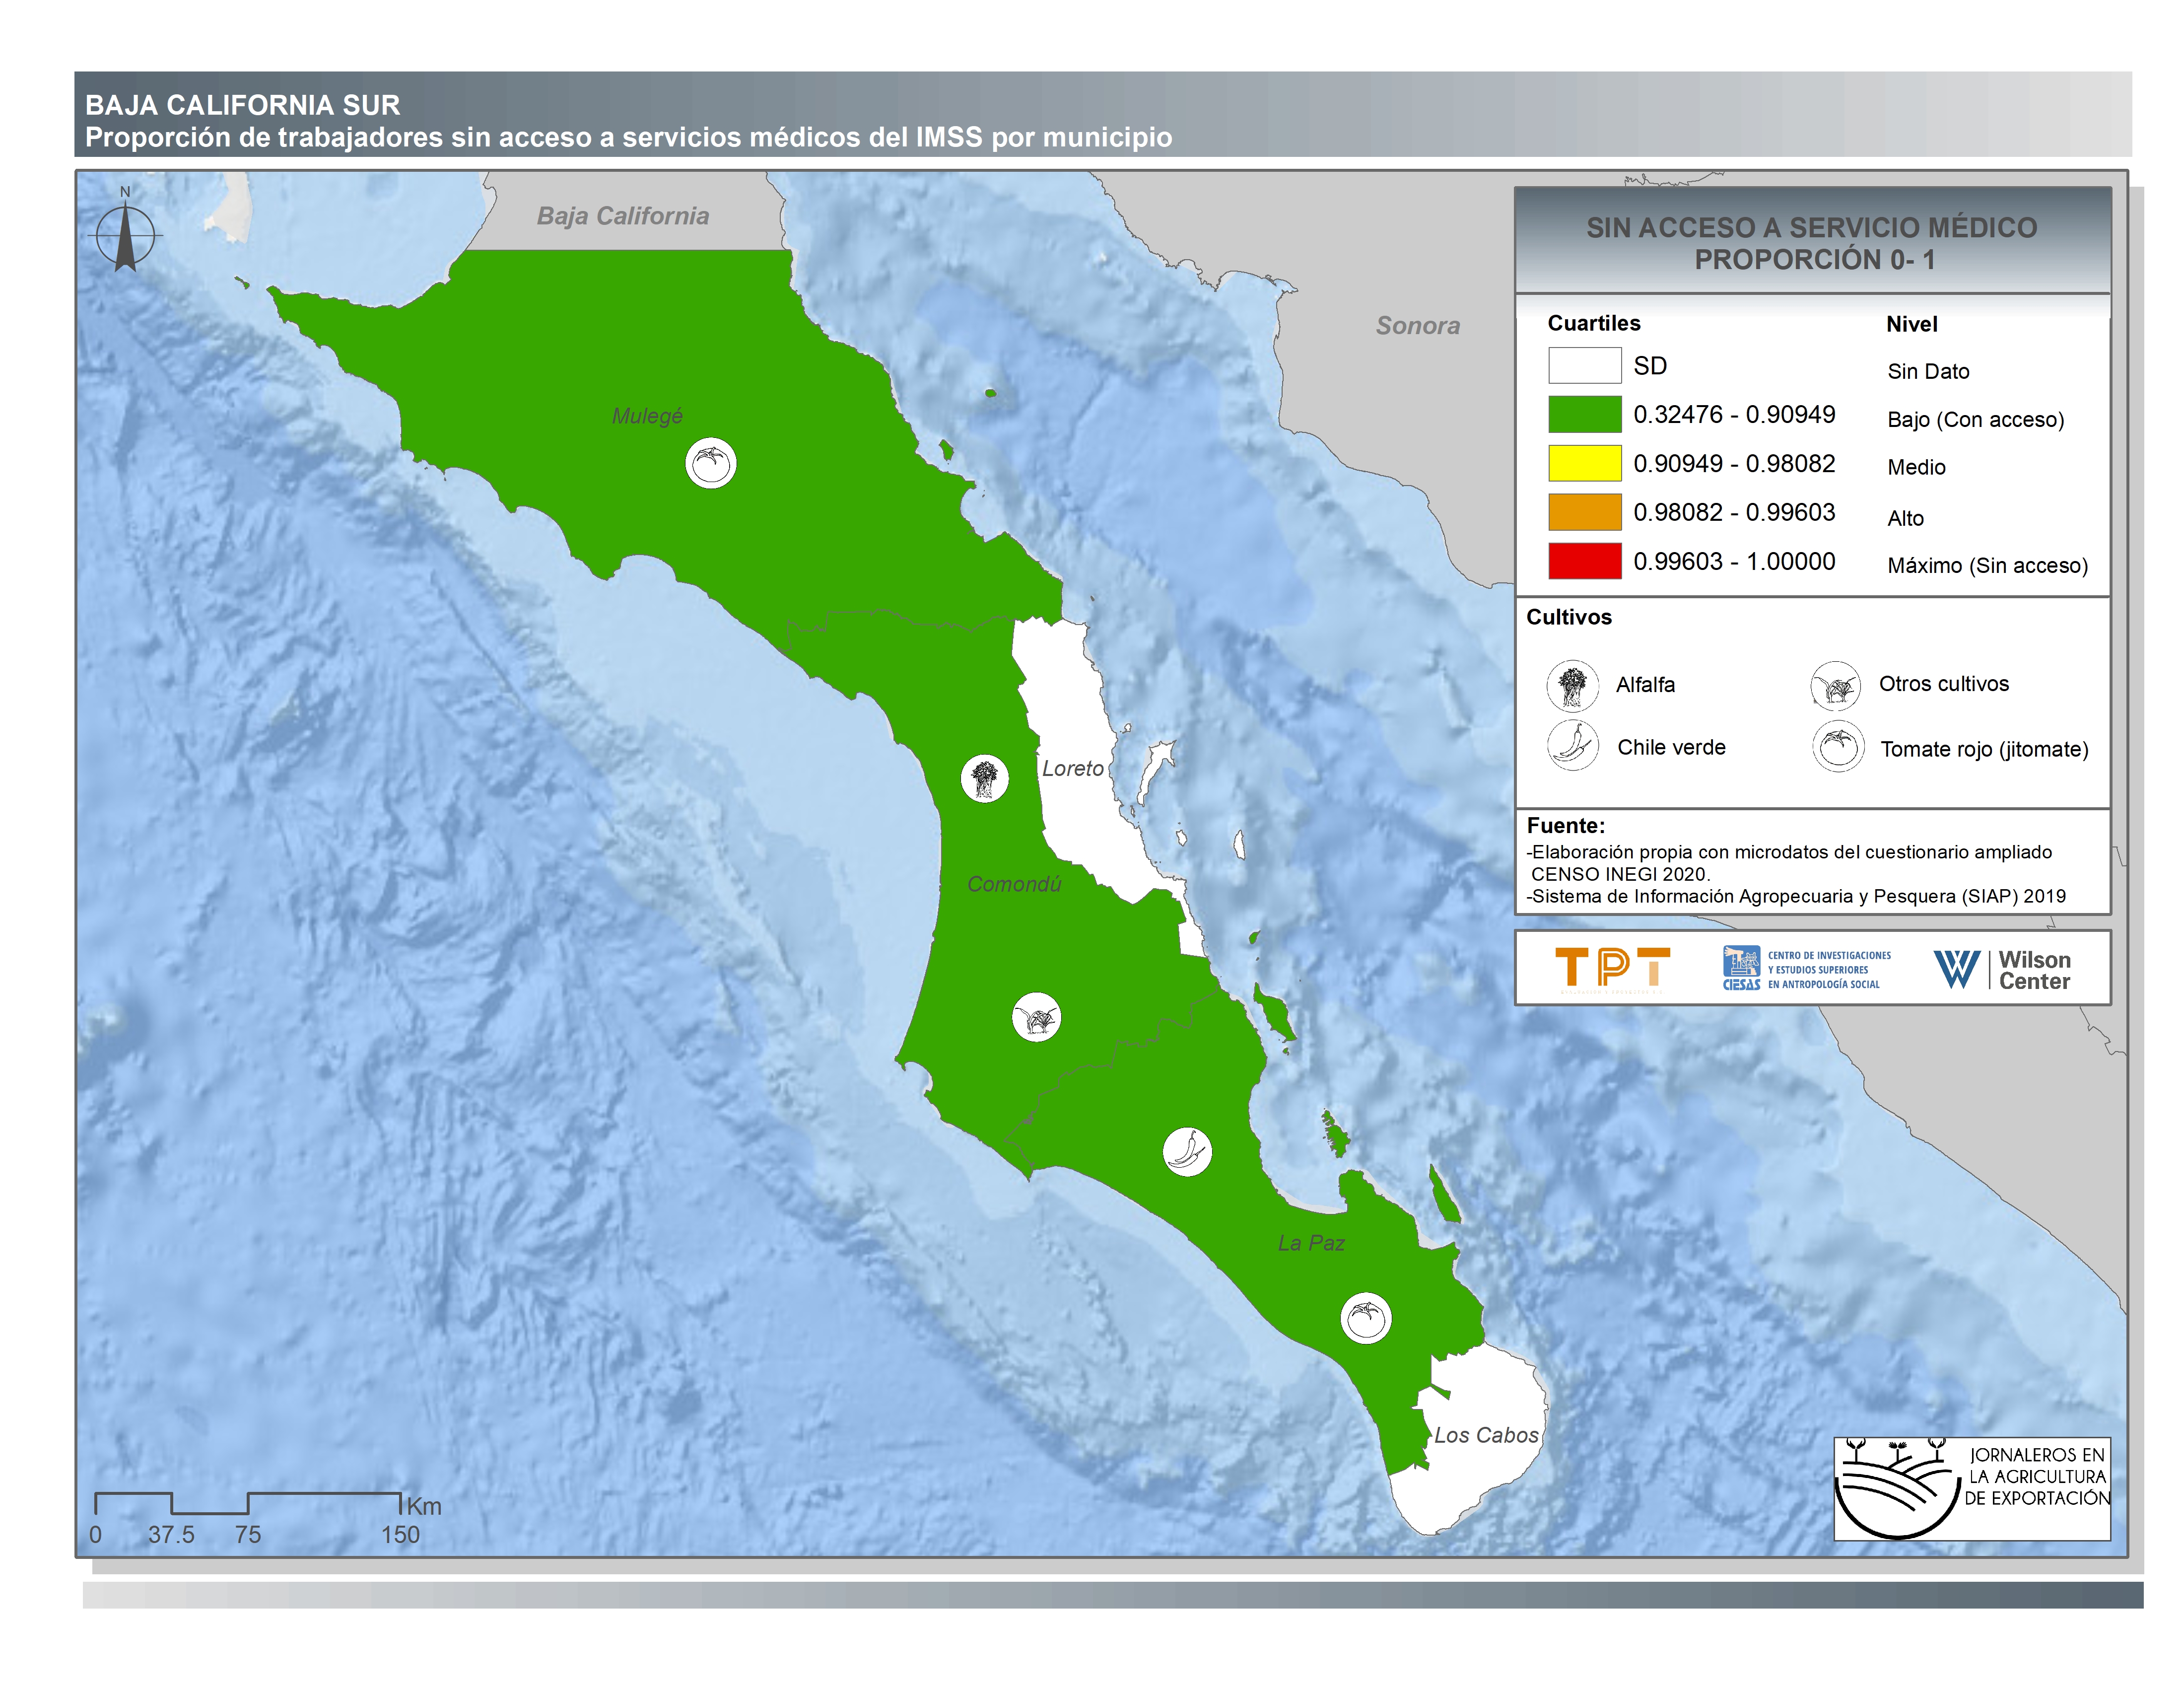
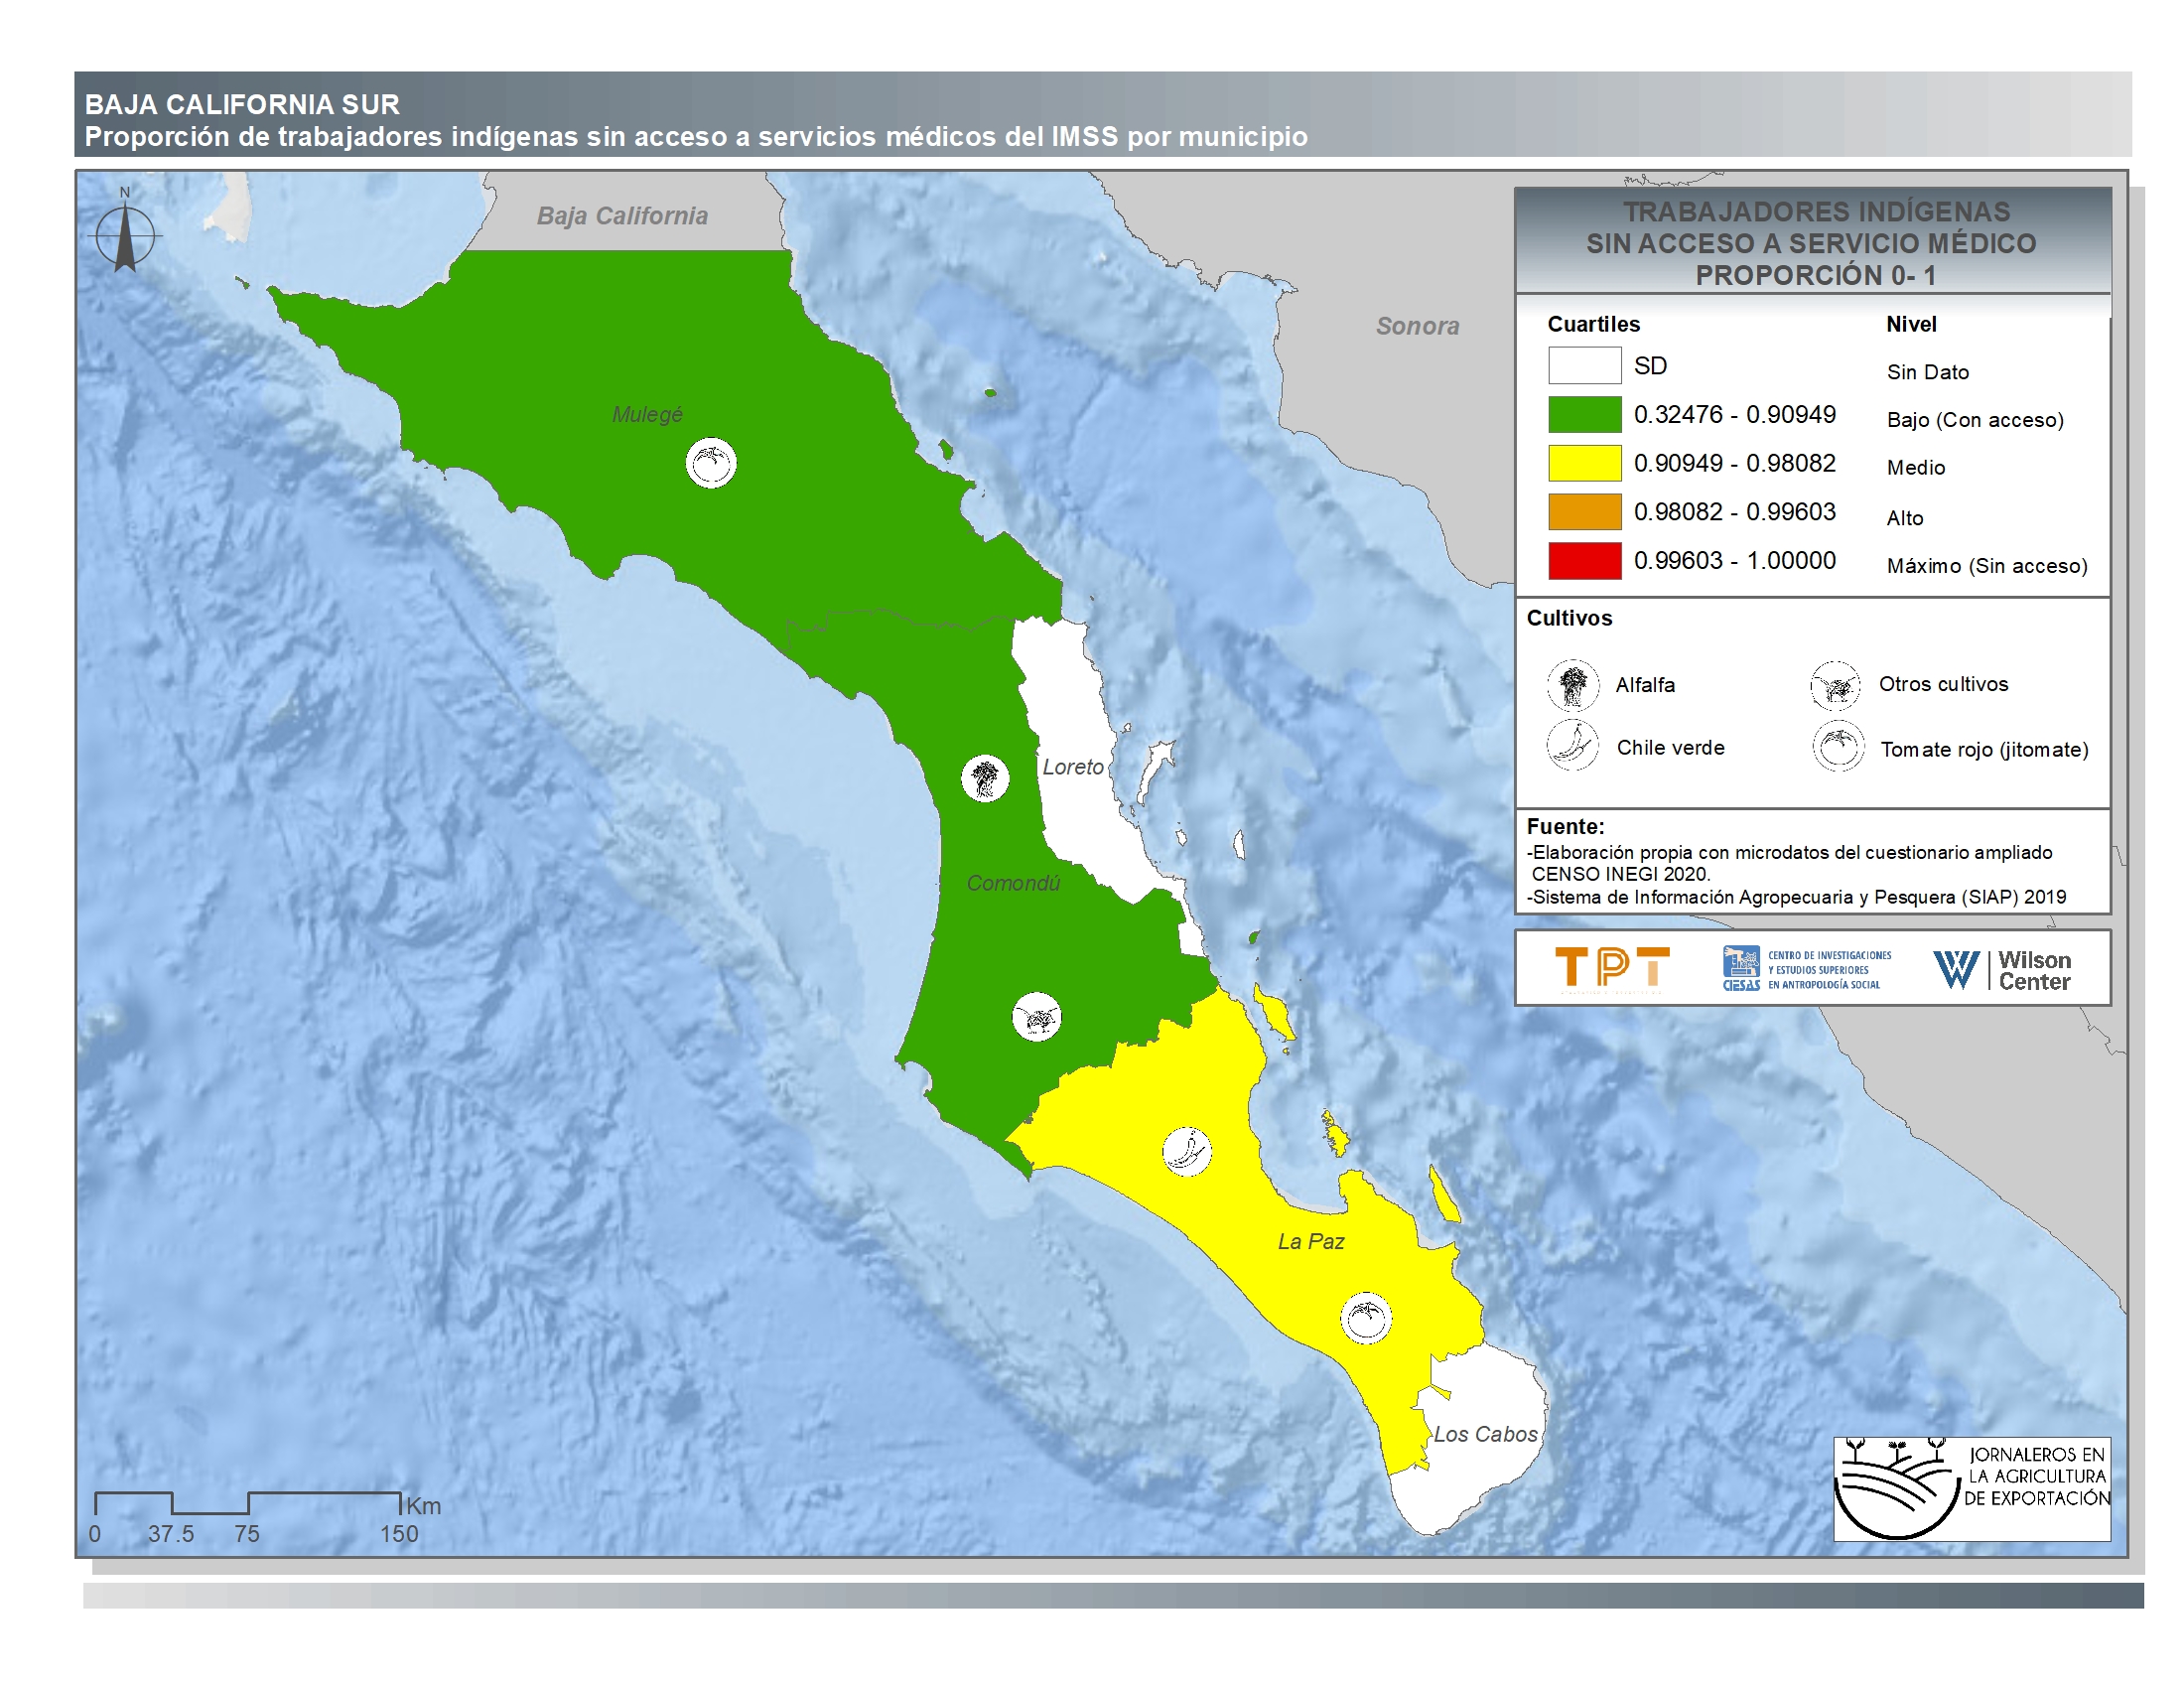
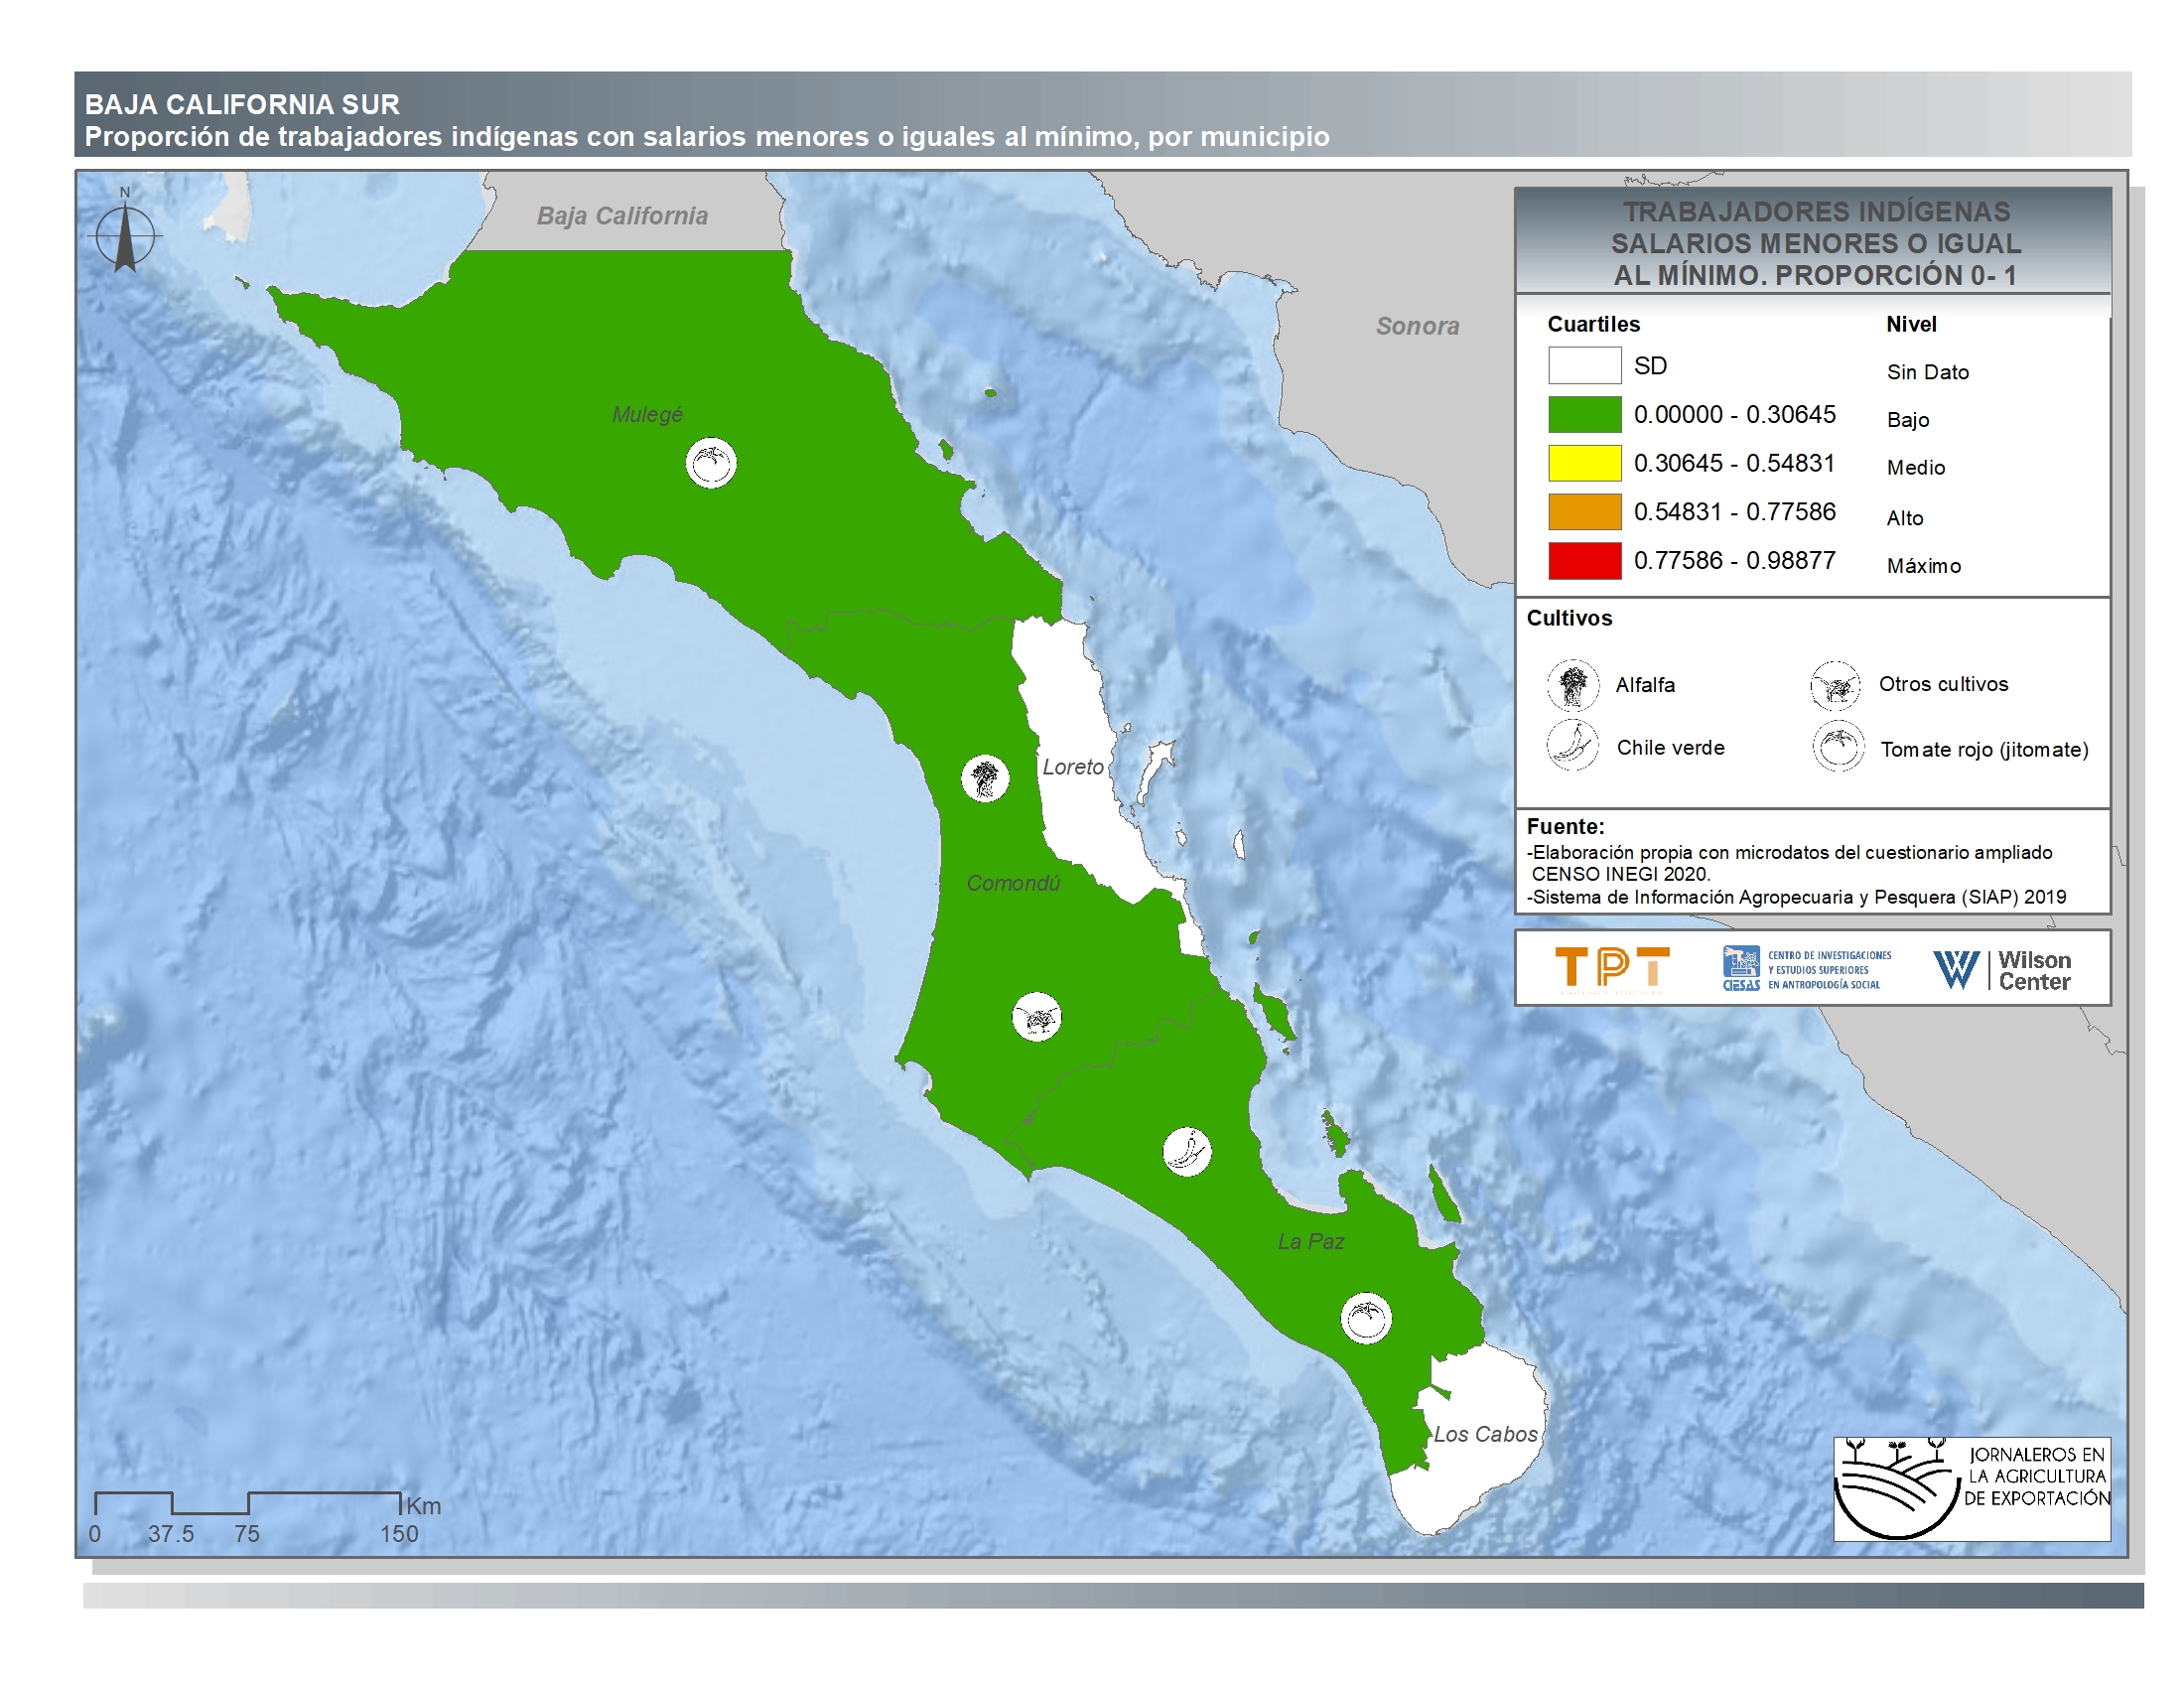
Baja California Sur
-
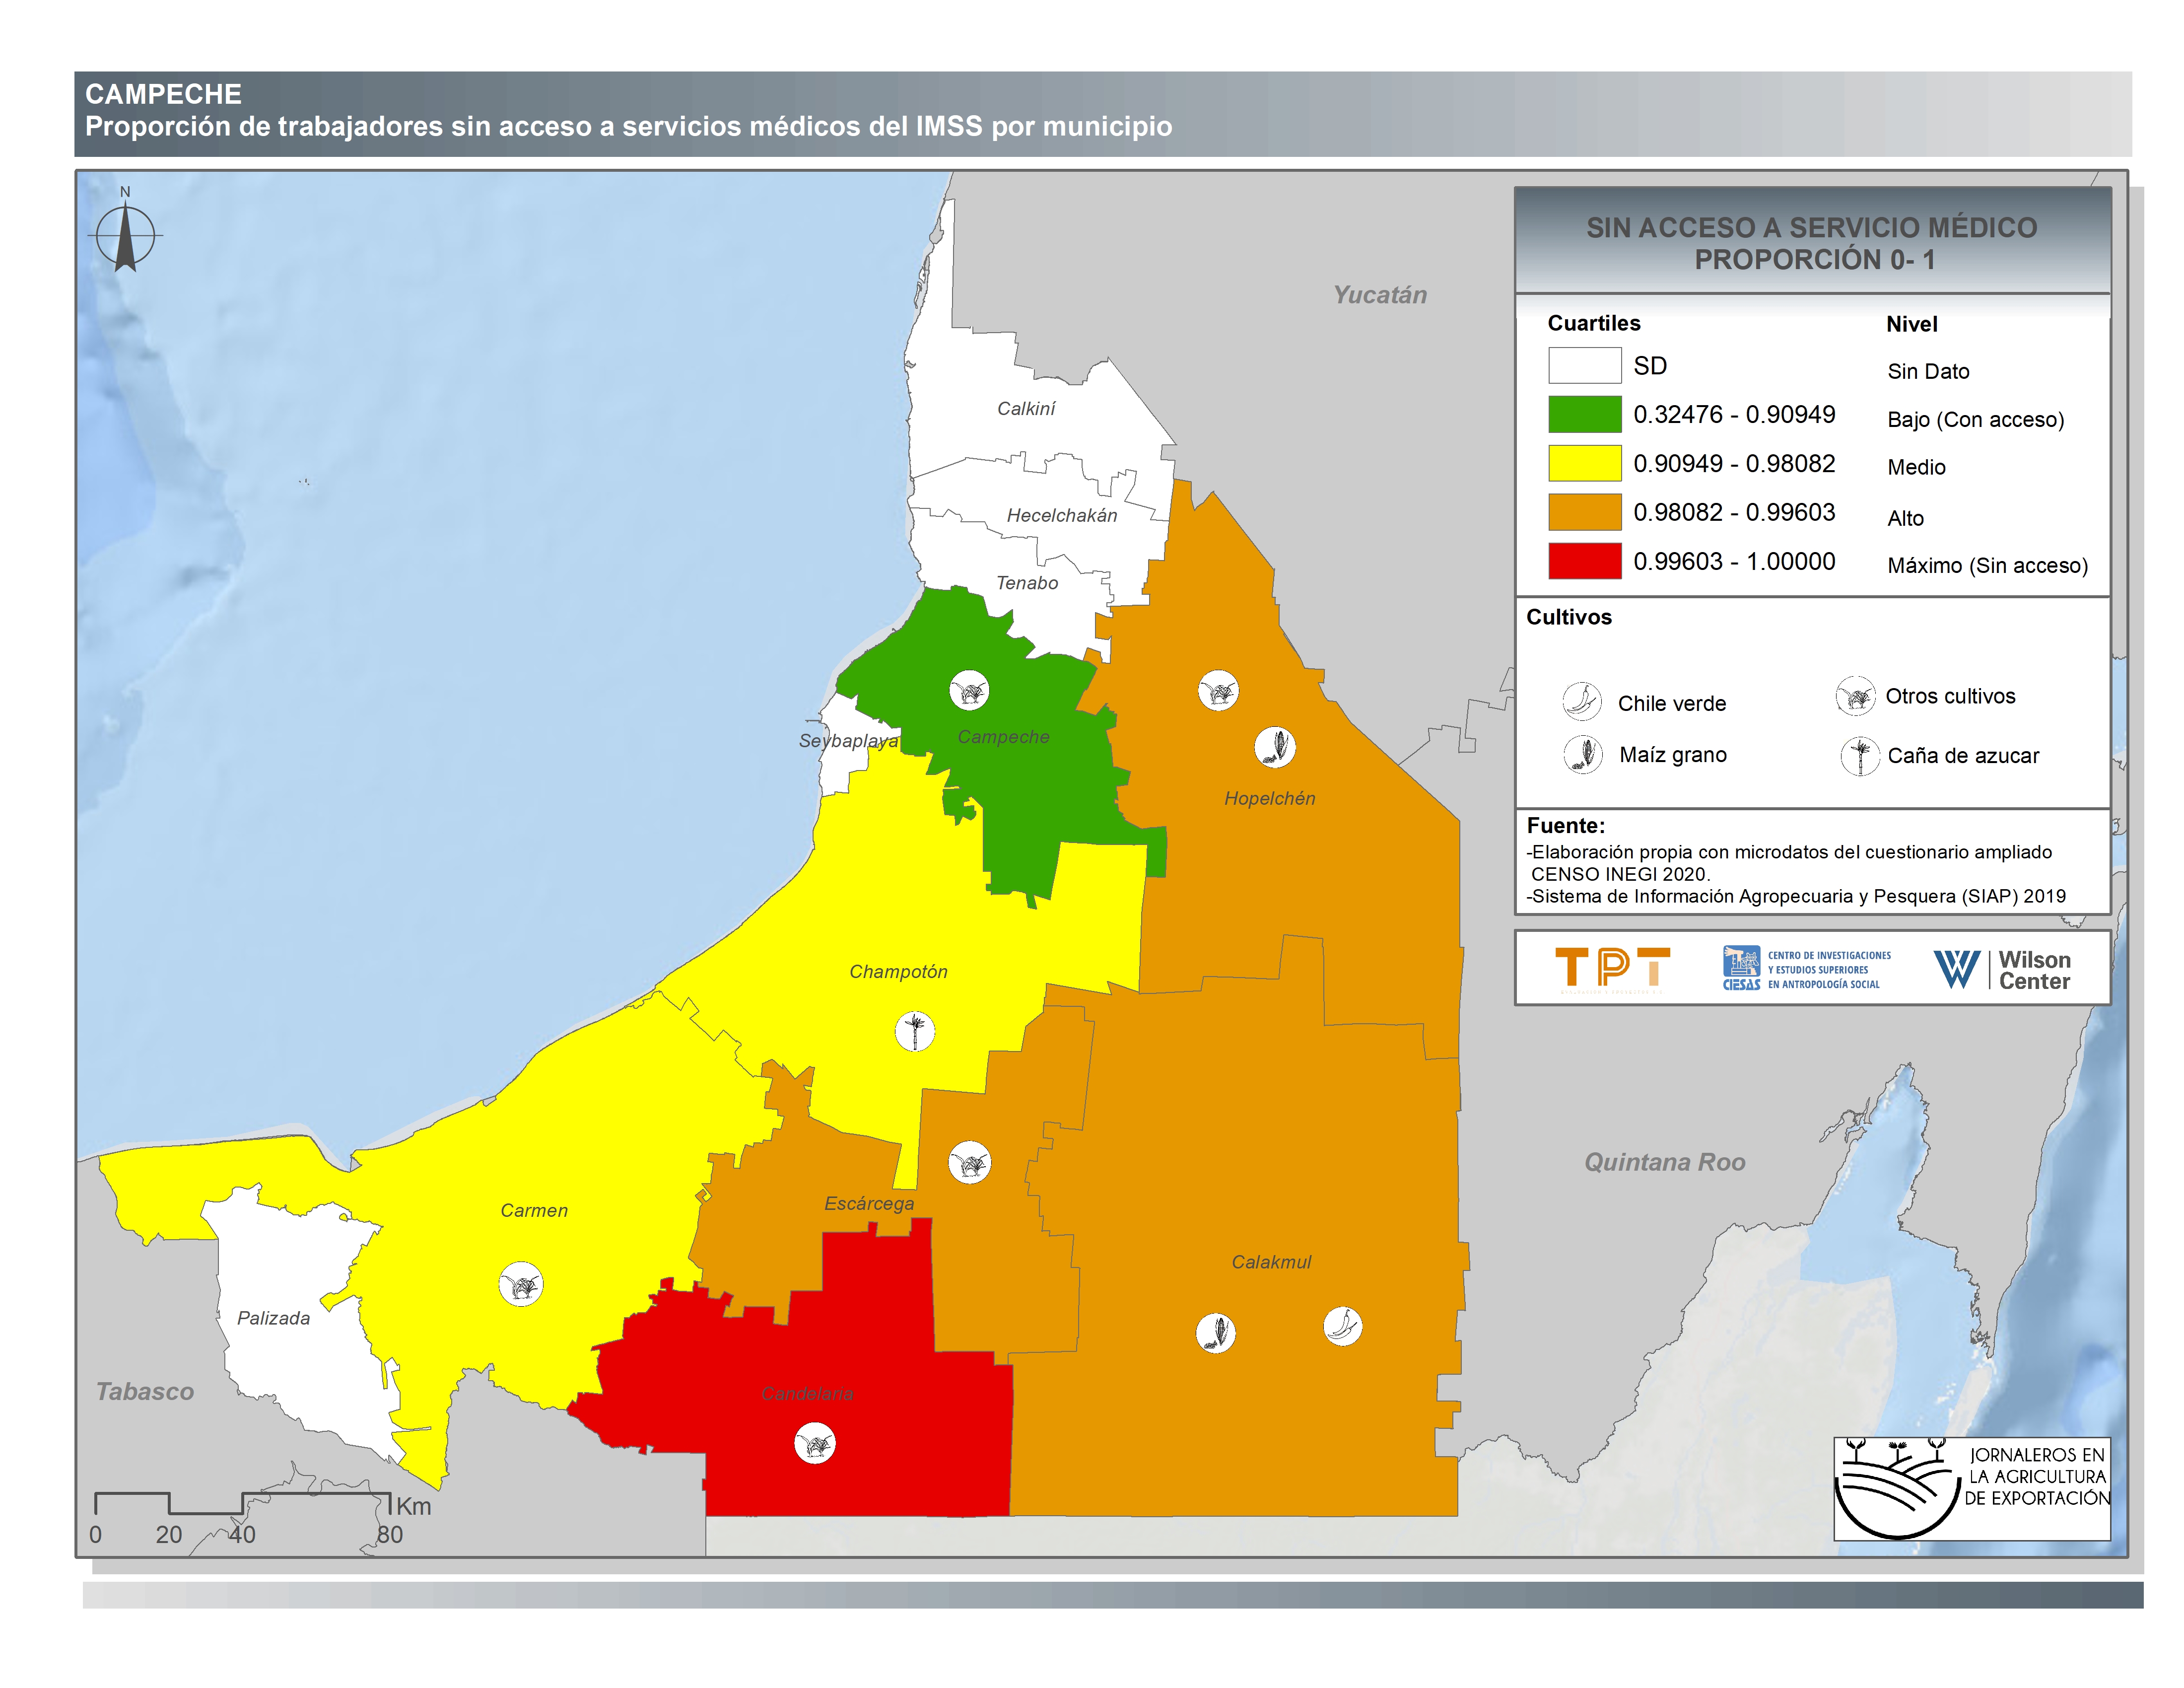
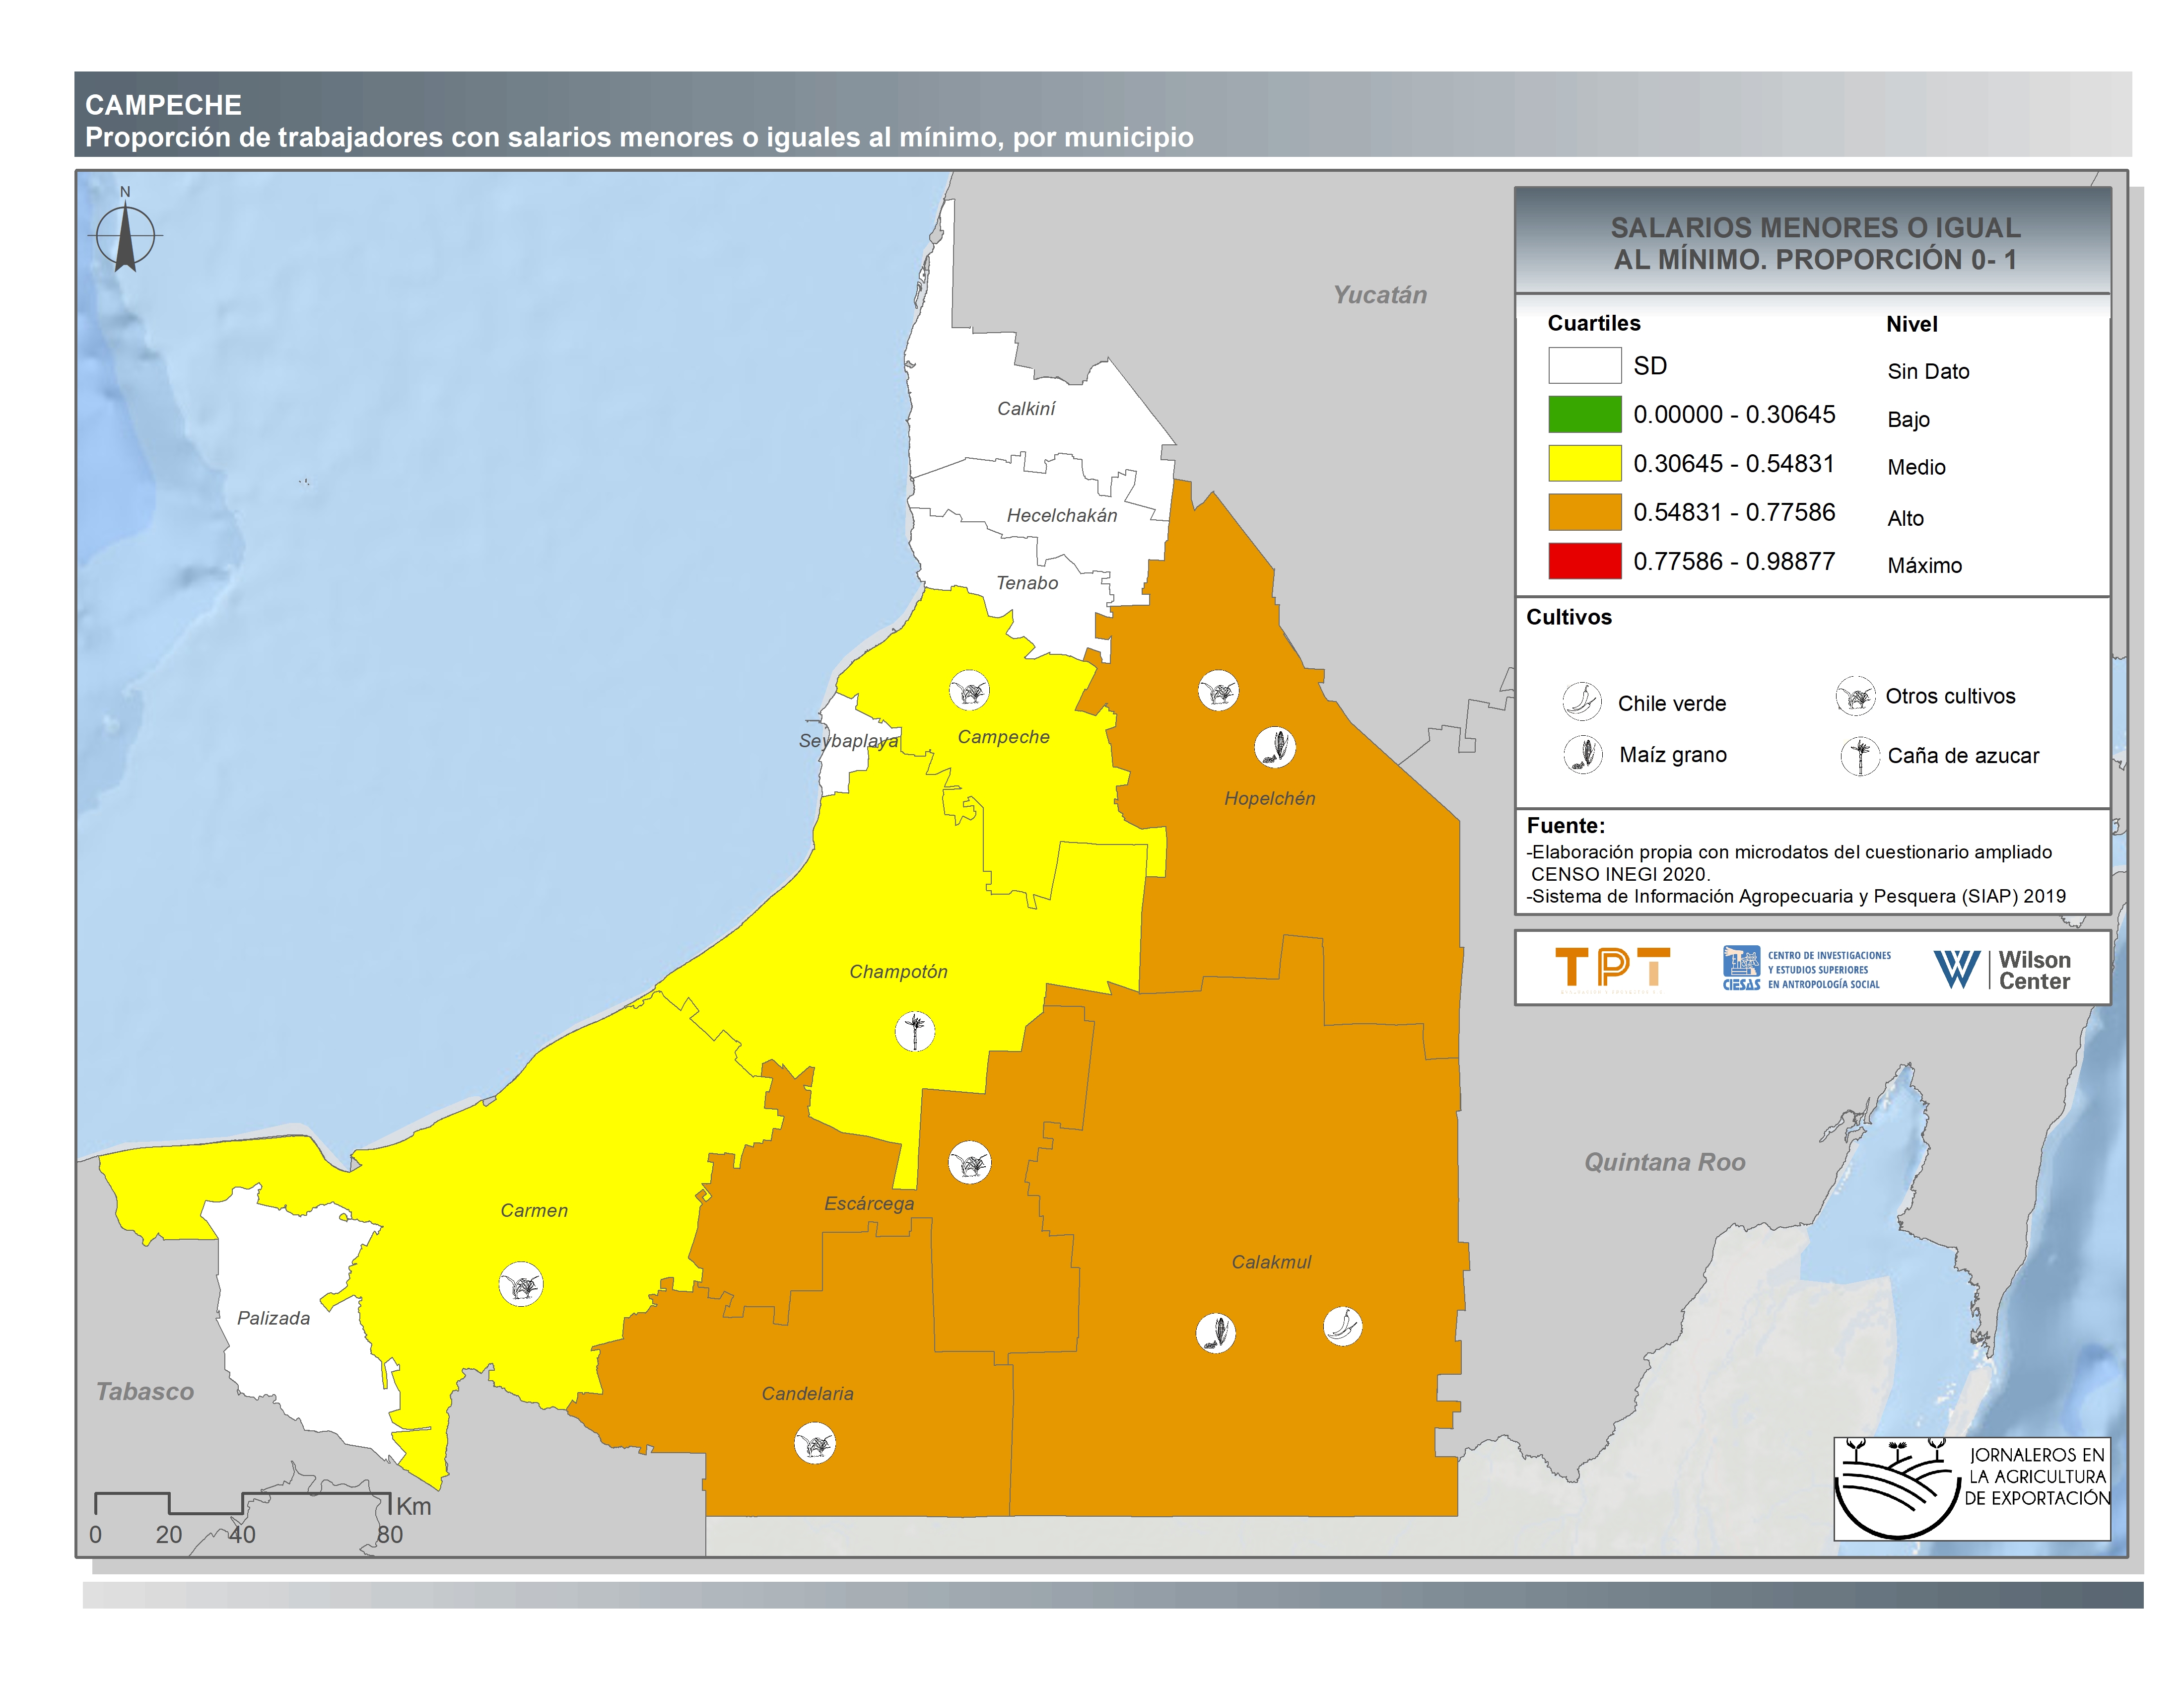
Campeche
-
Ciudad de México
-
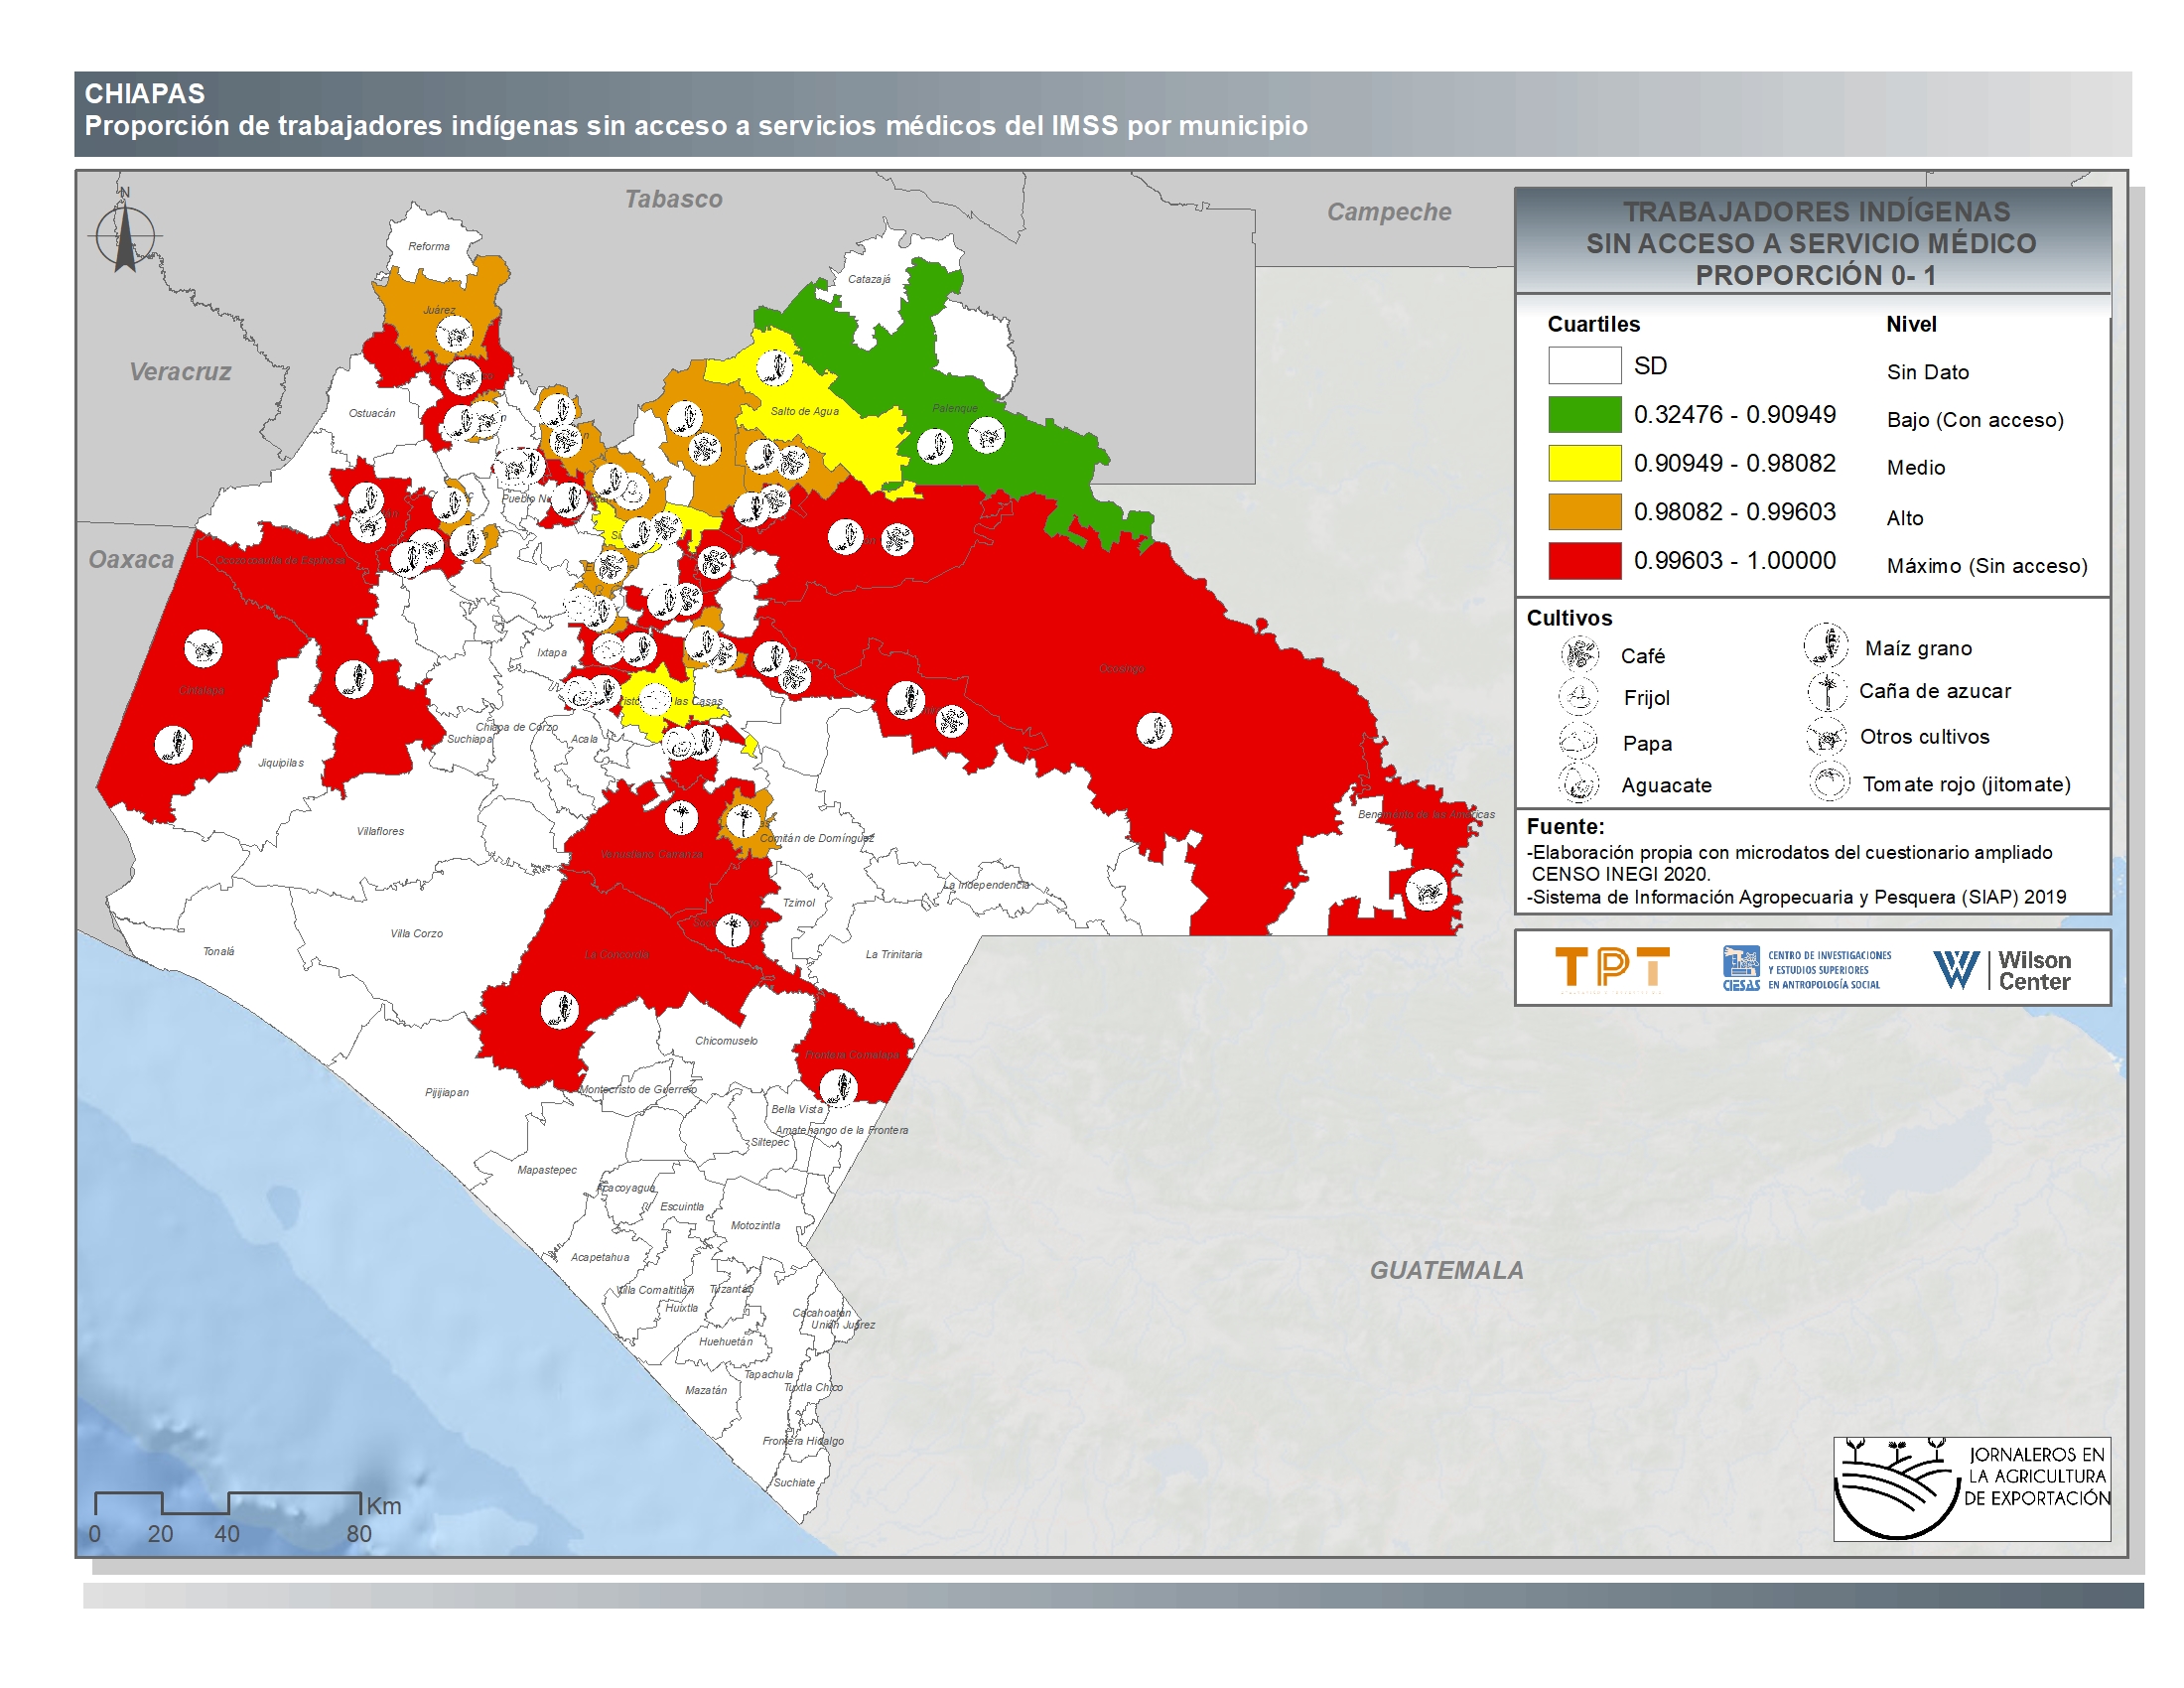
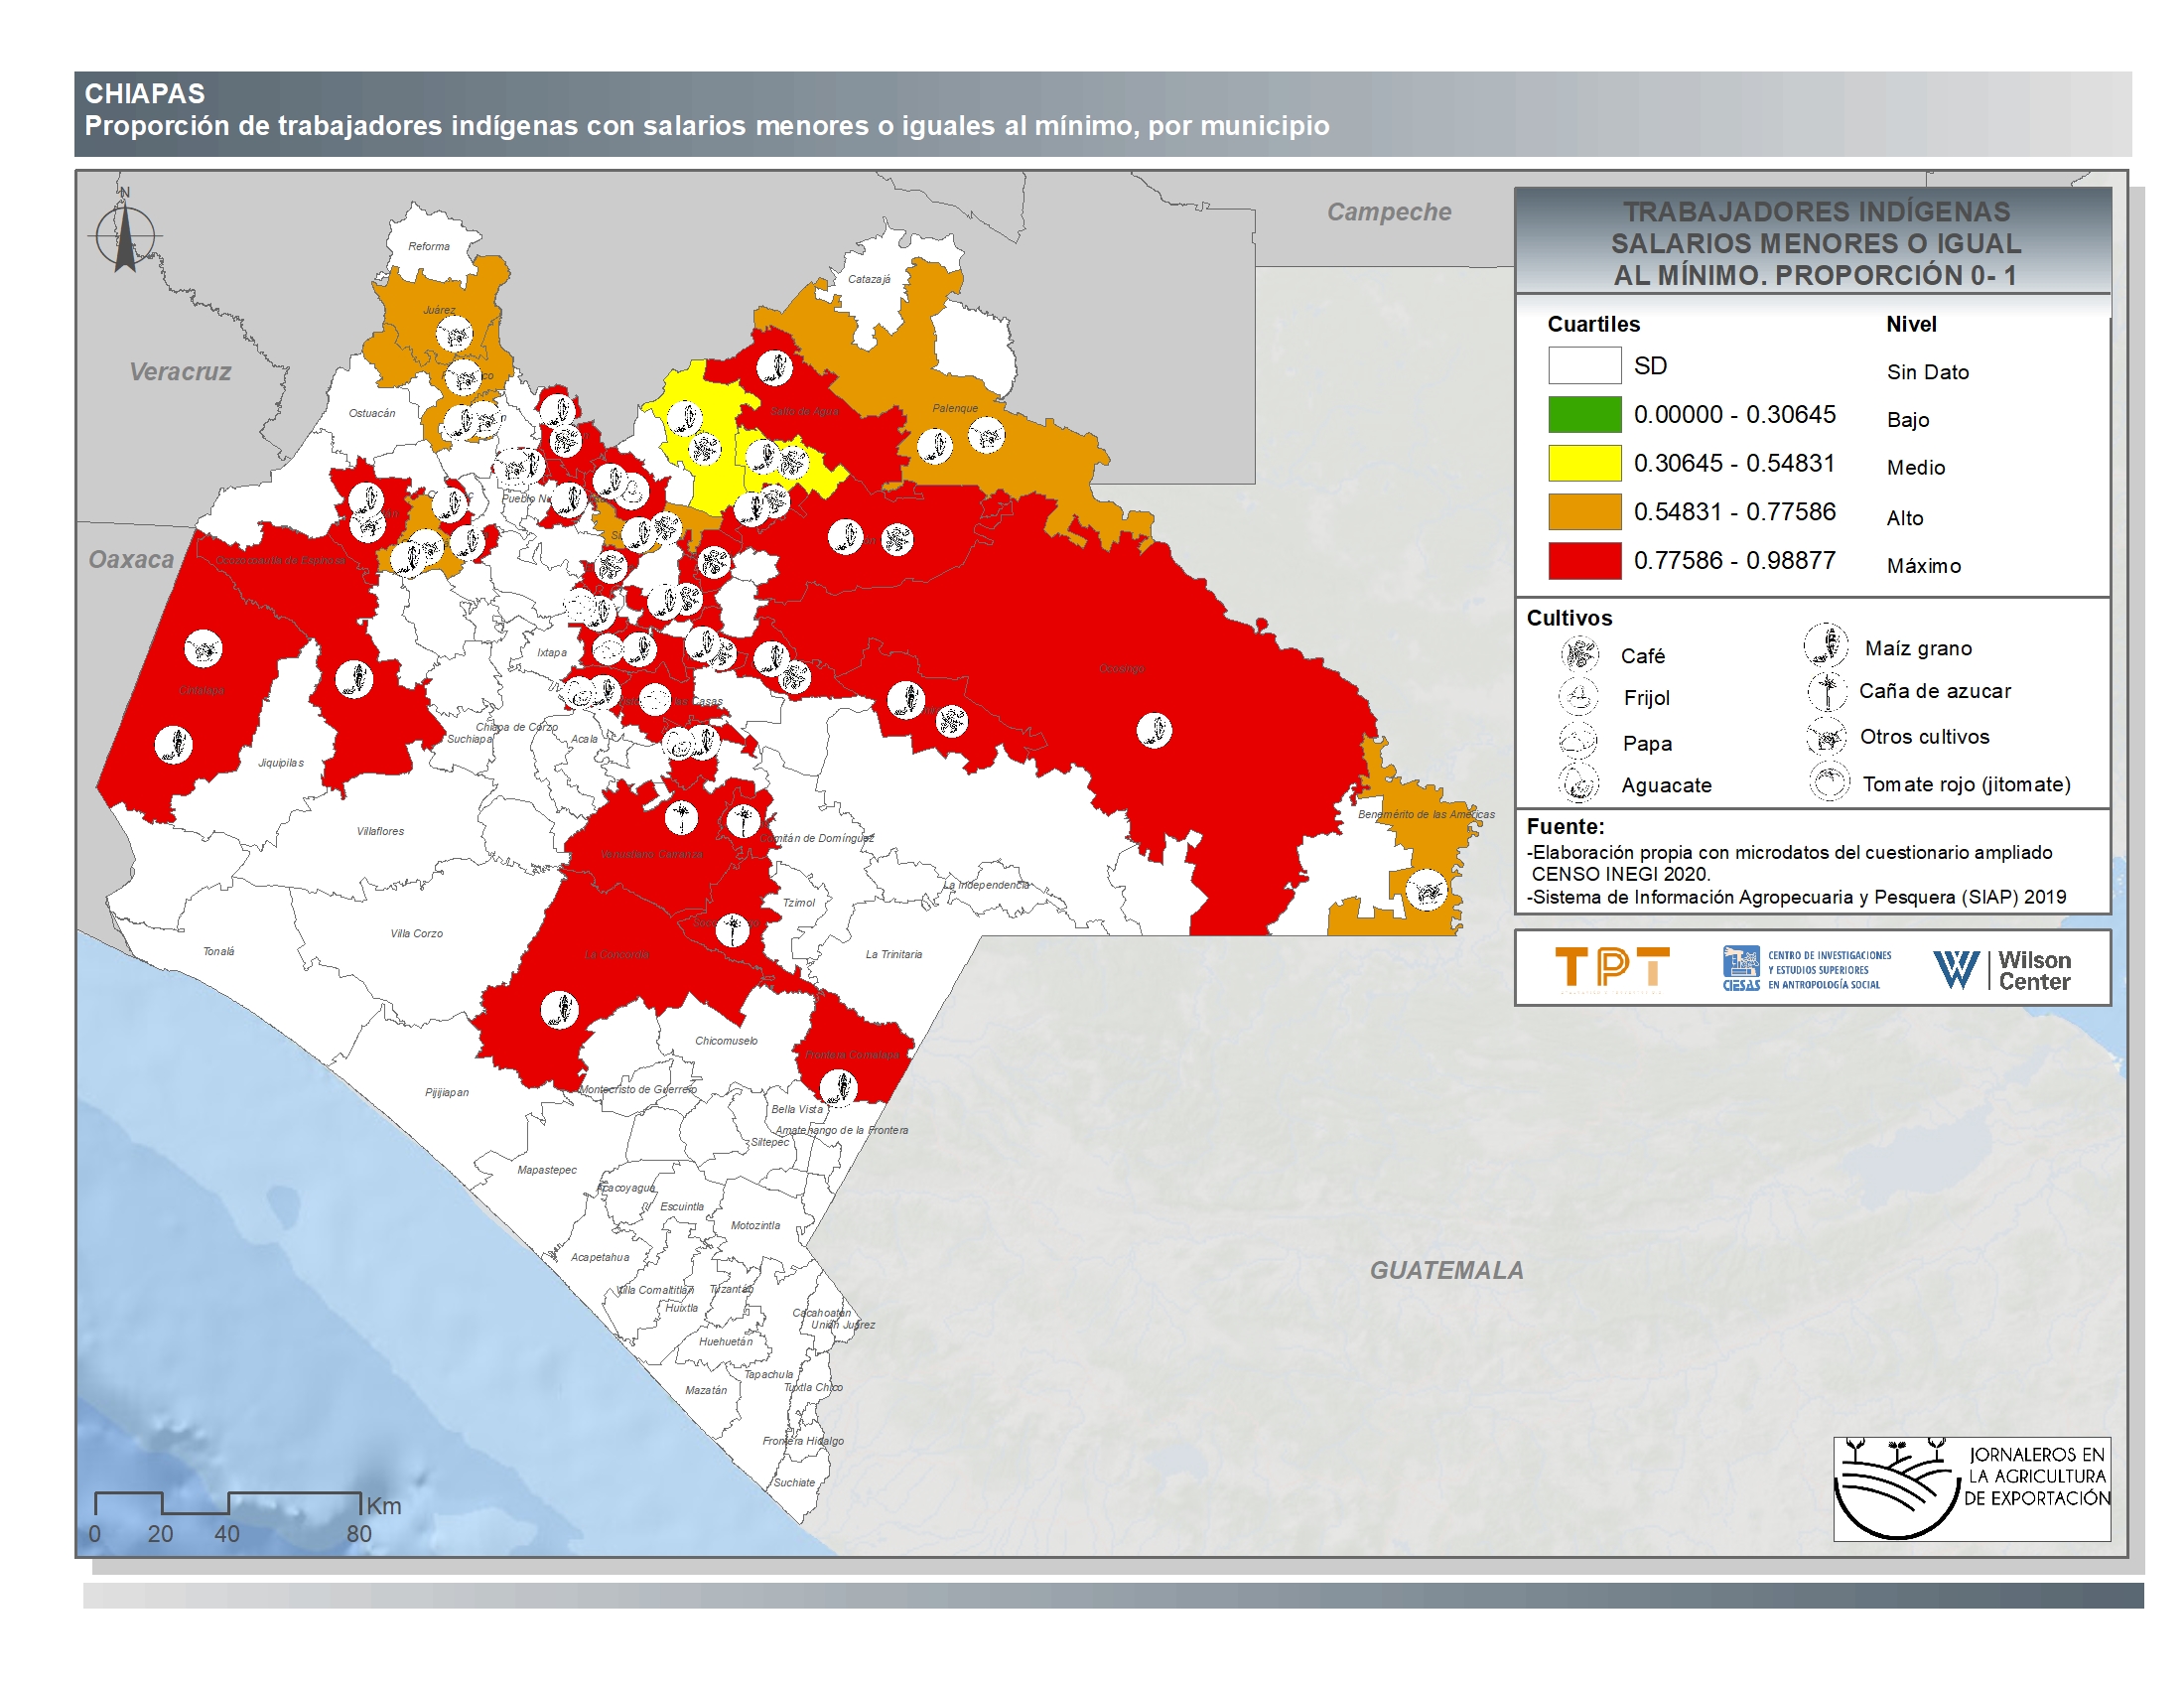
Chiapas
-
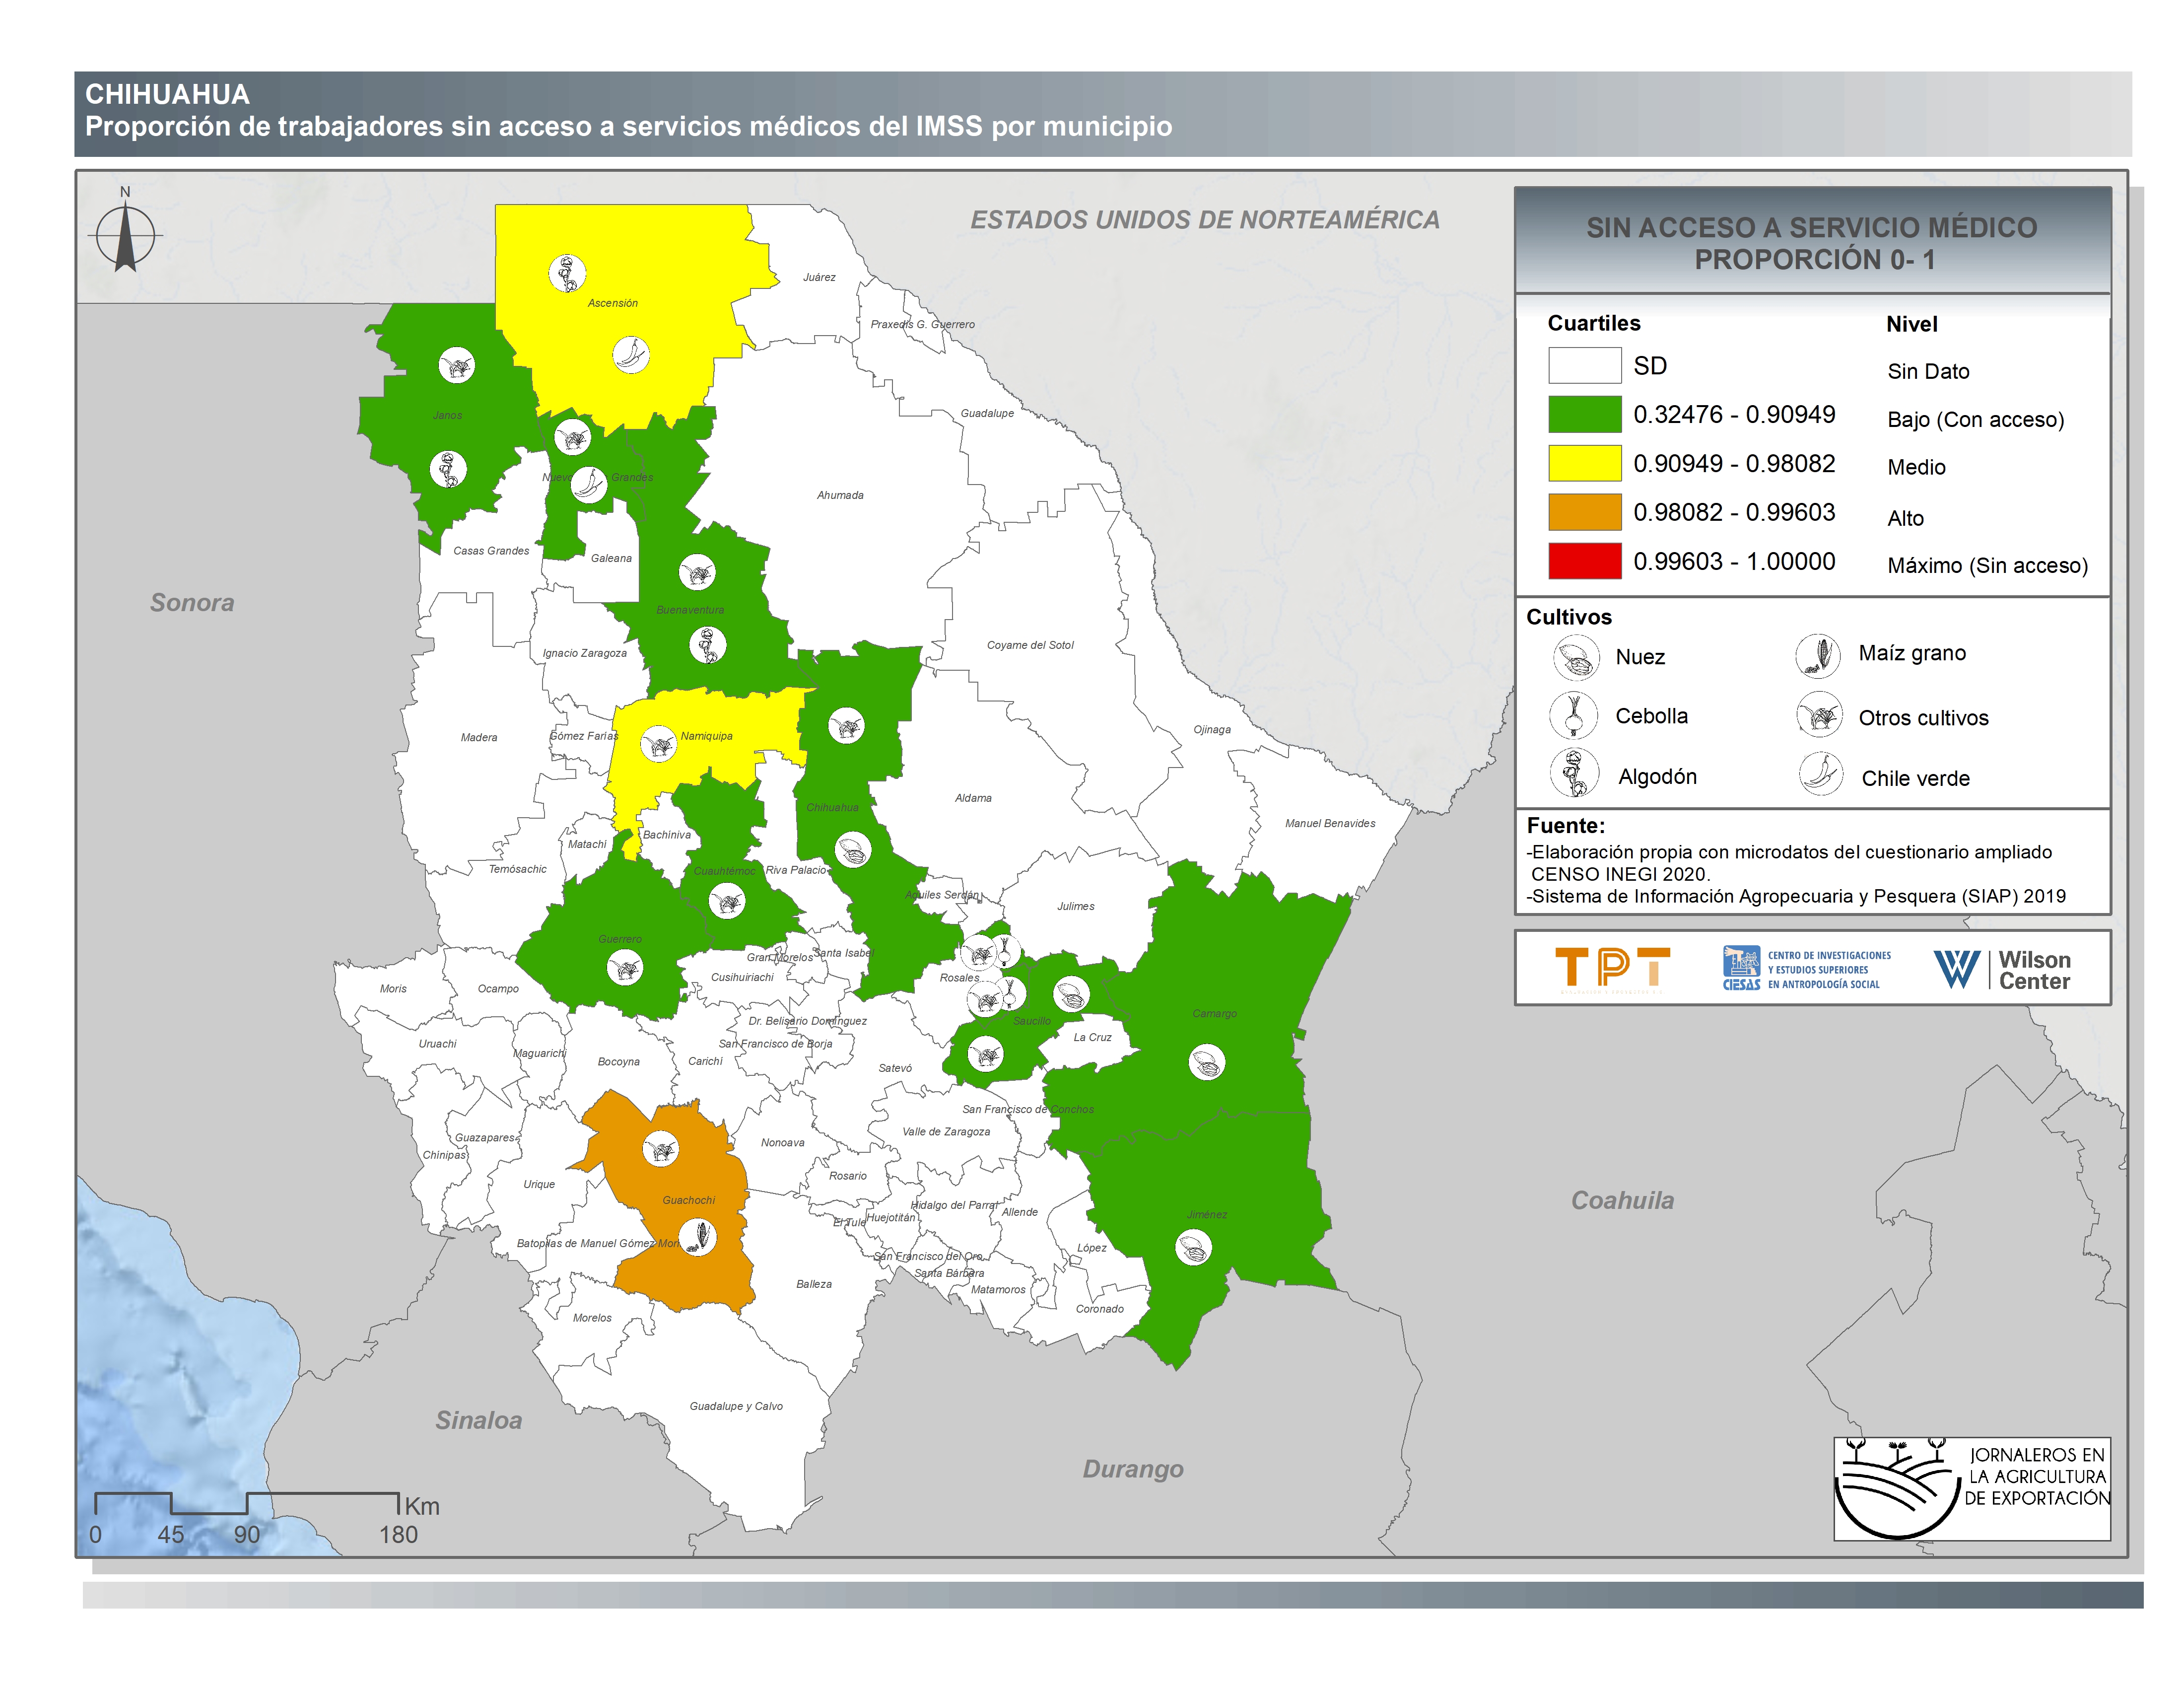
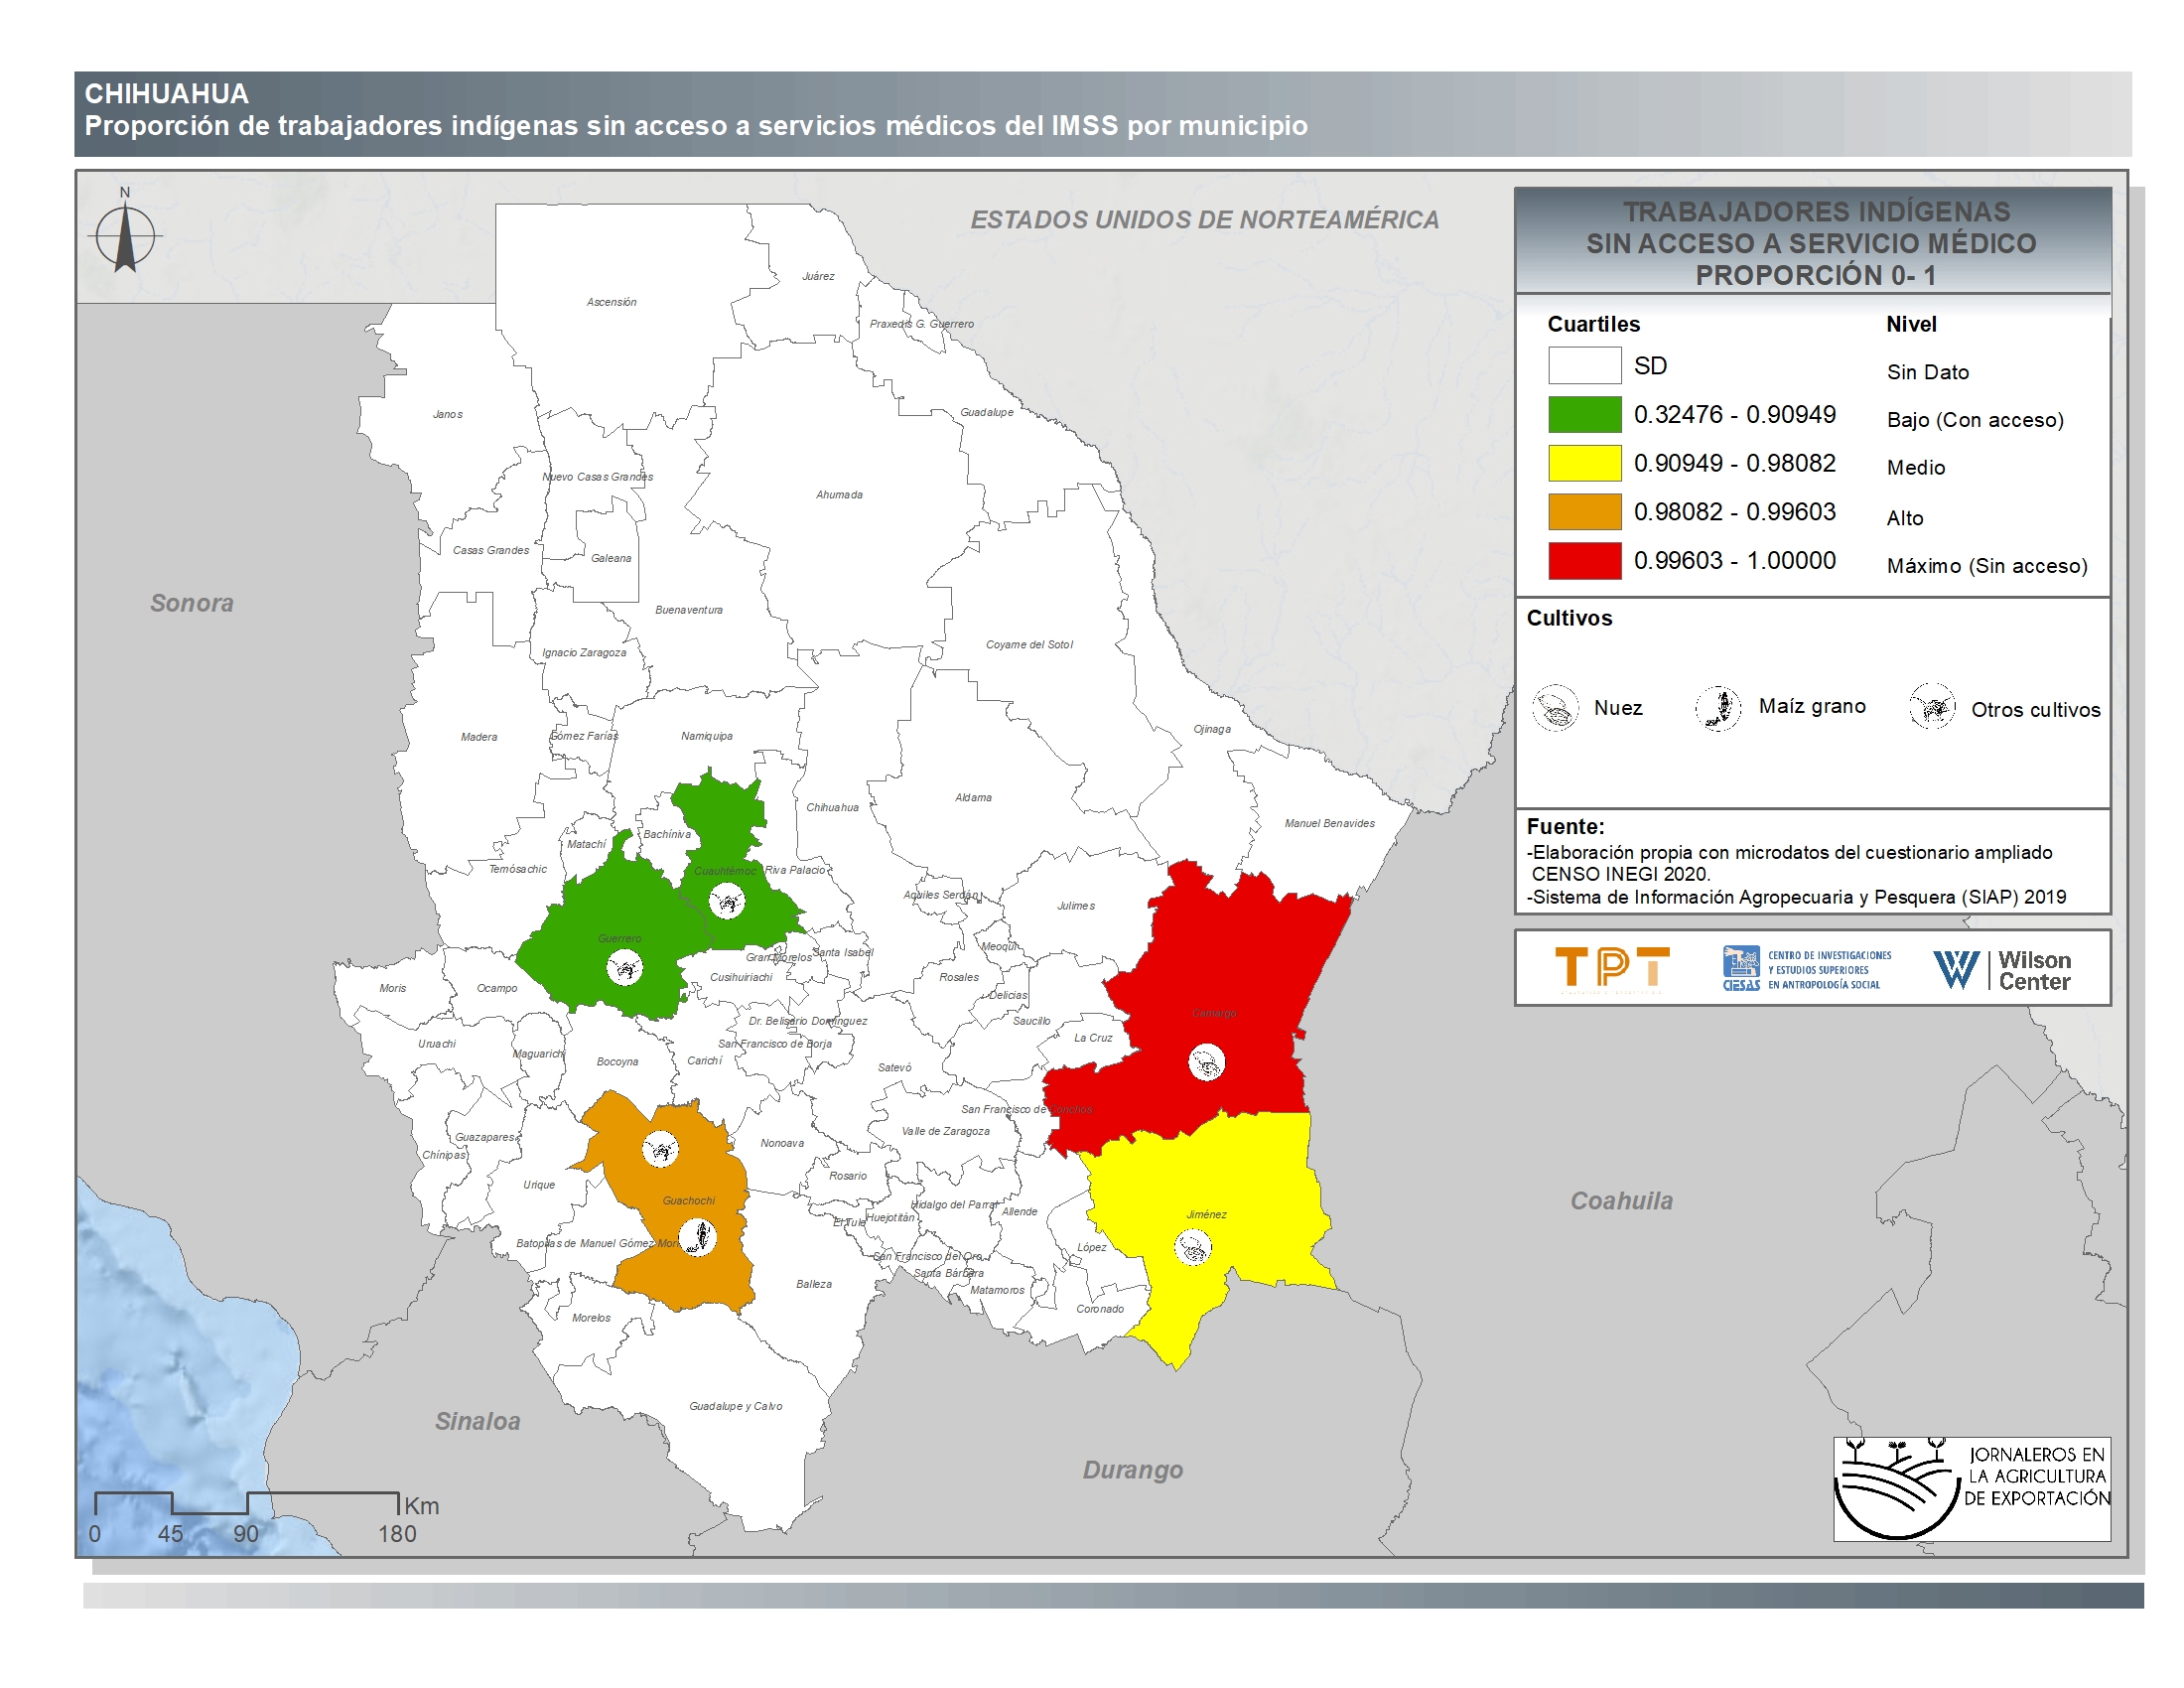
Chihuahua
-
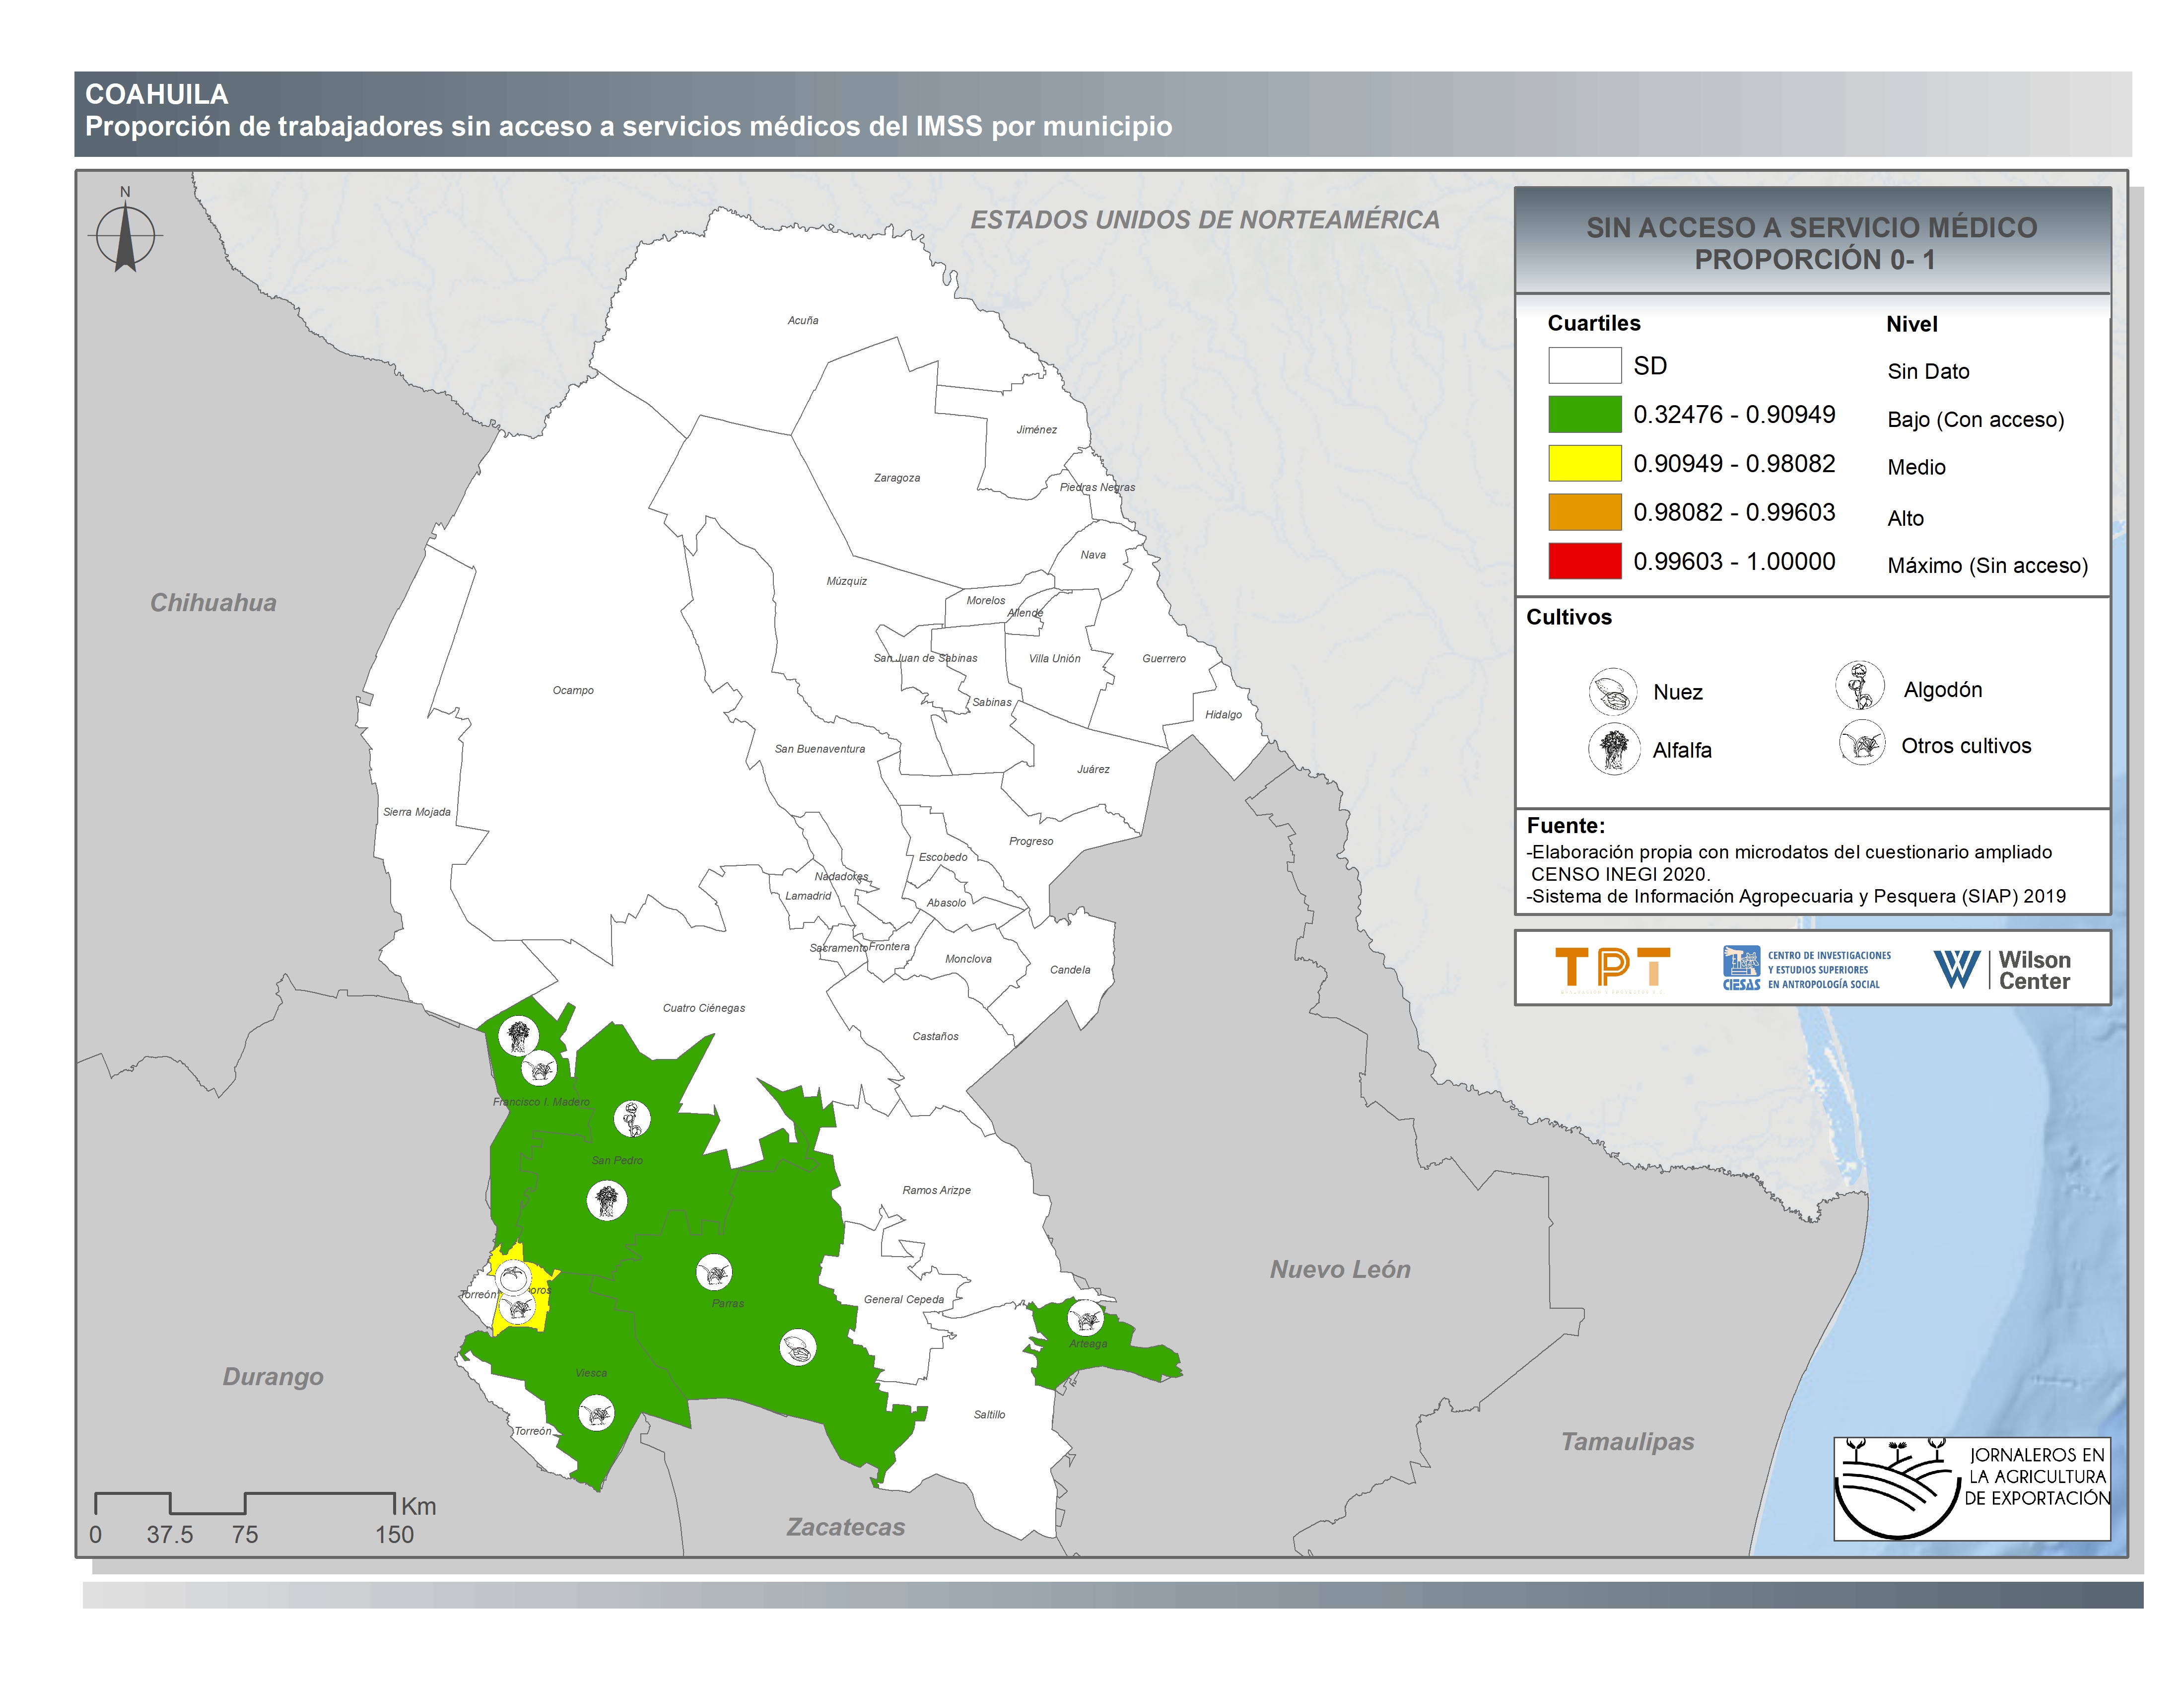
Coahuila
-
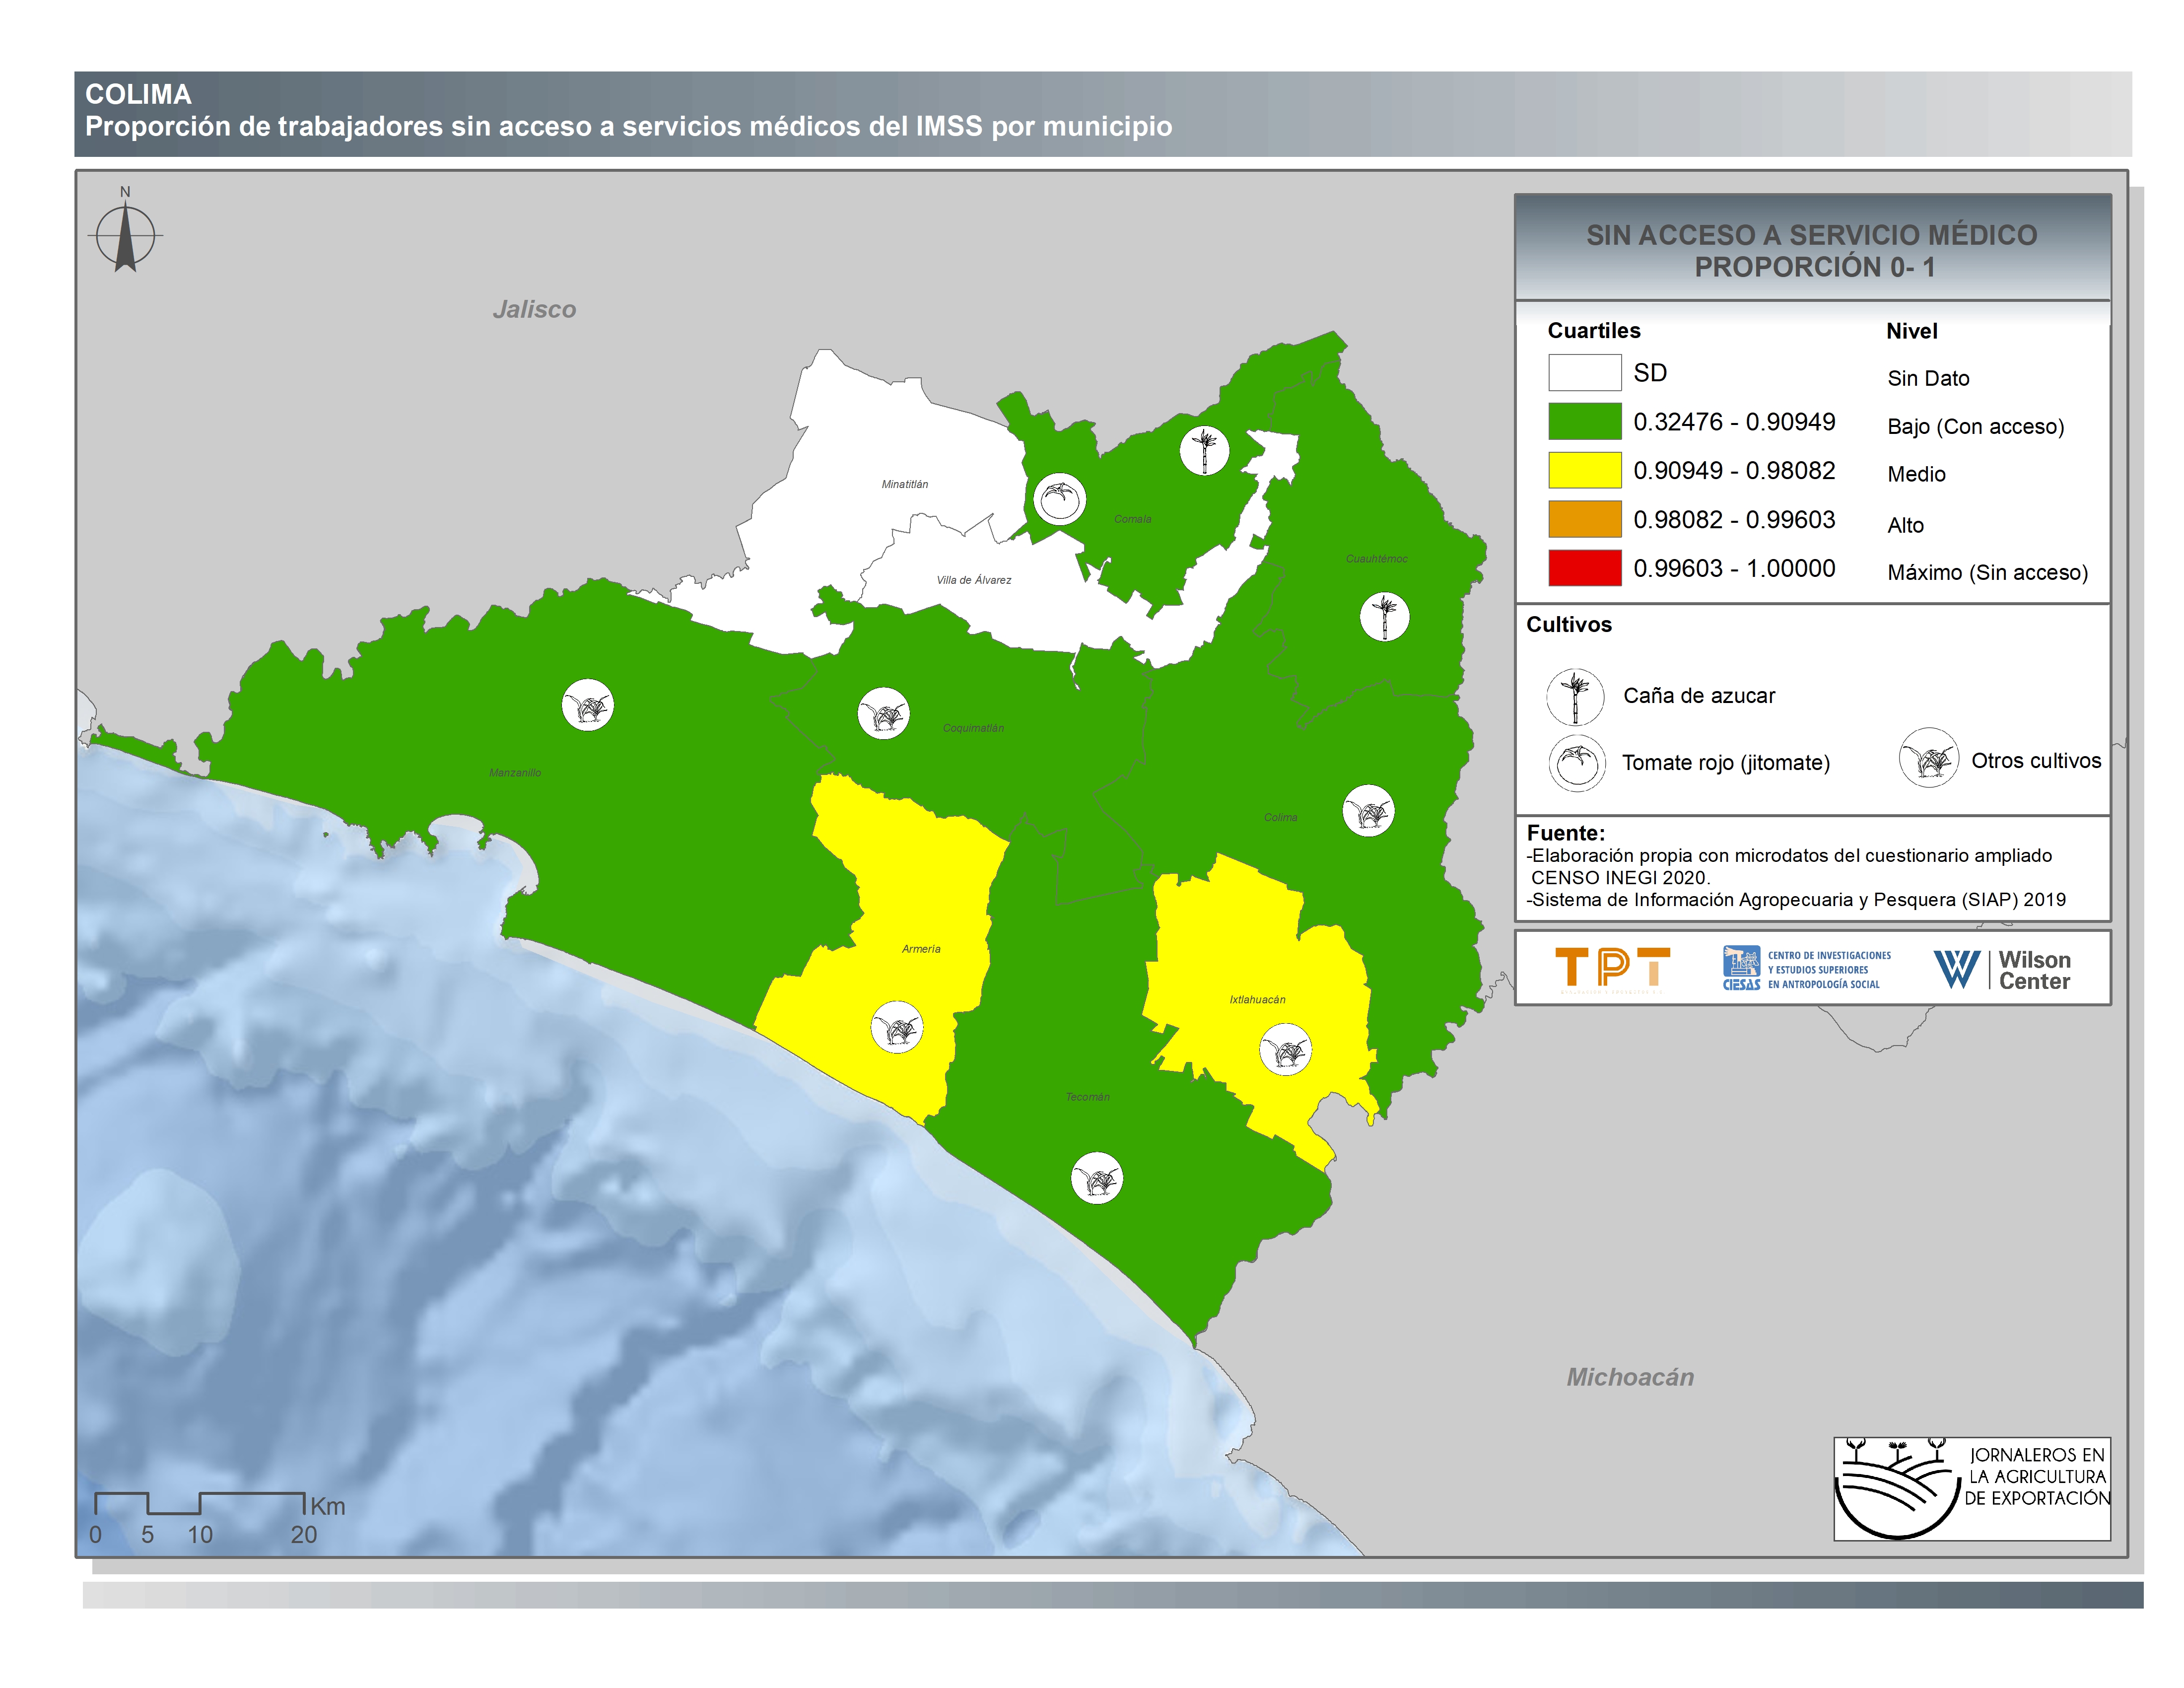
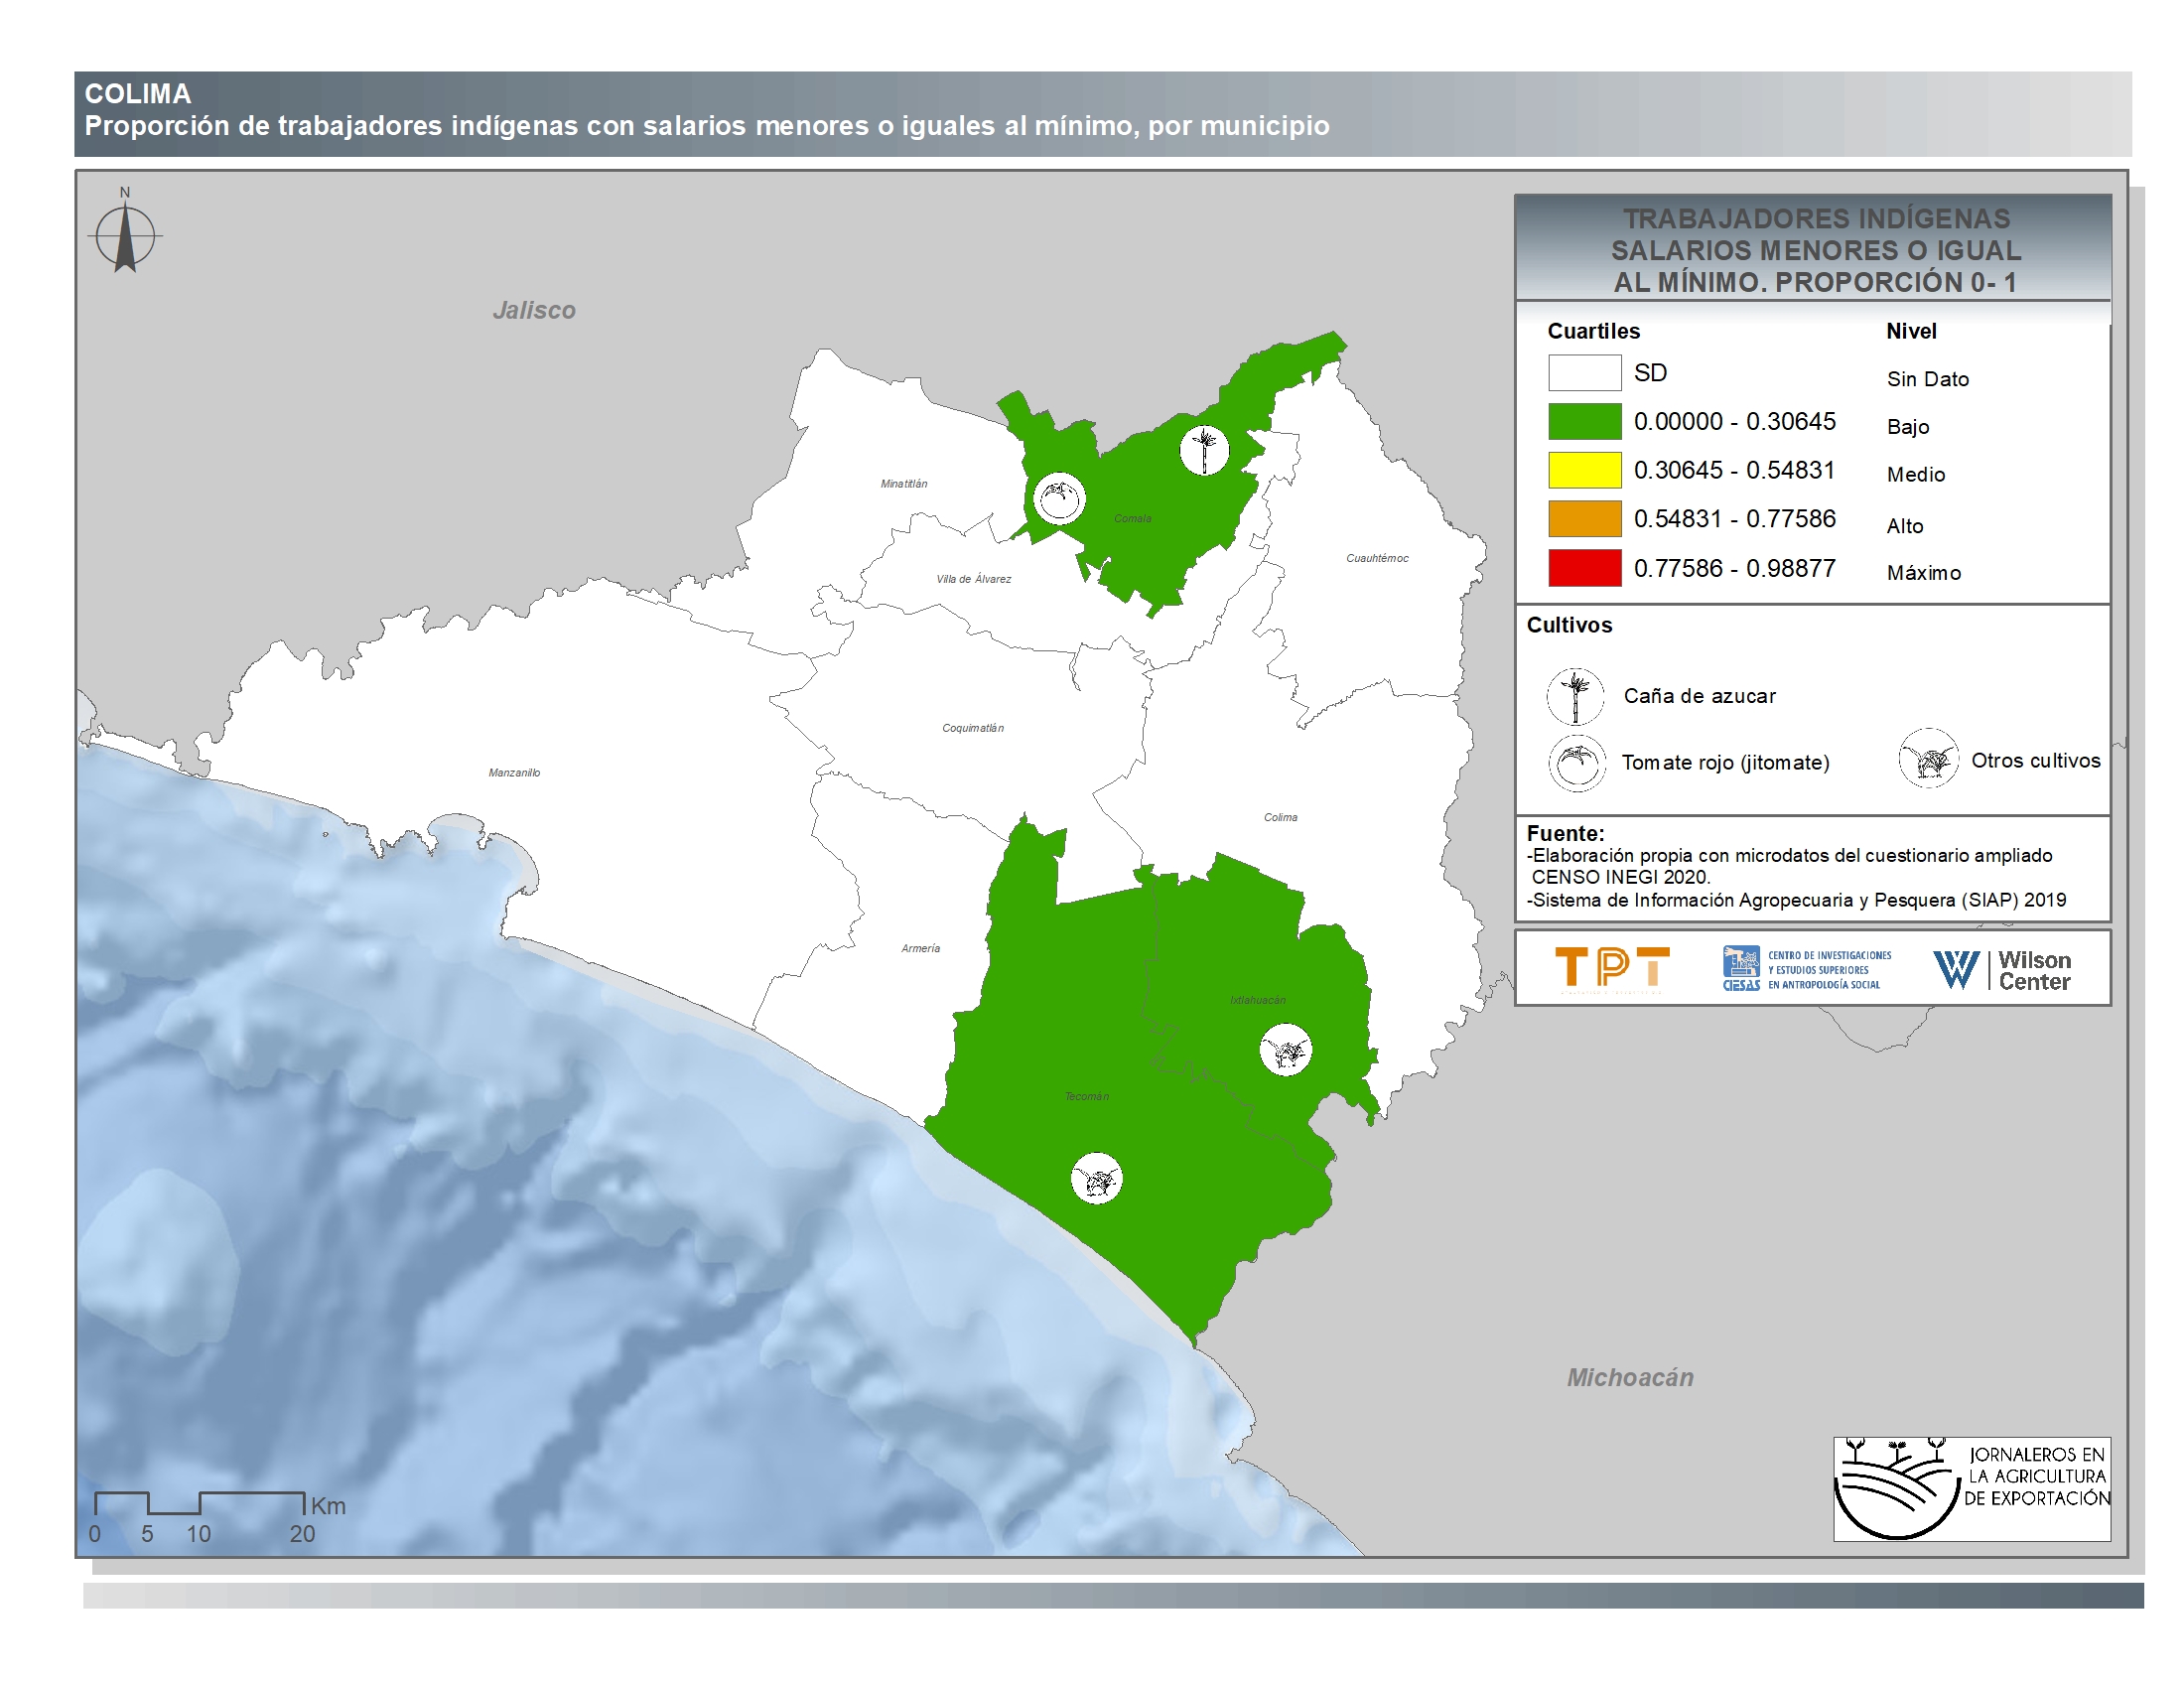
Colima
-
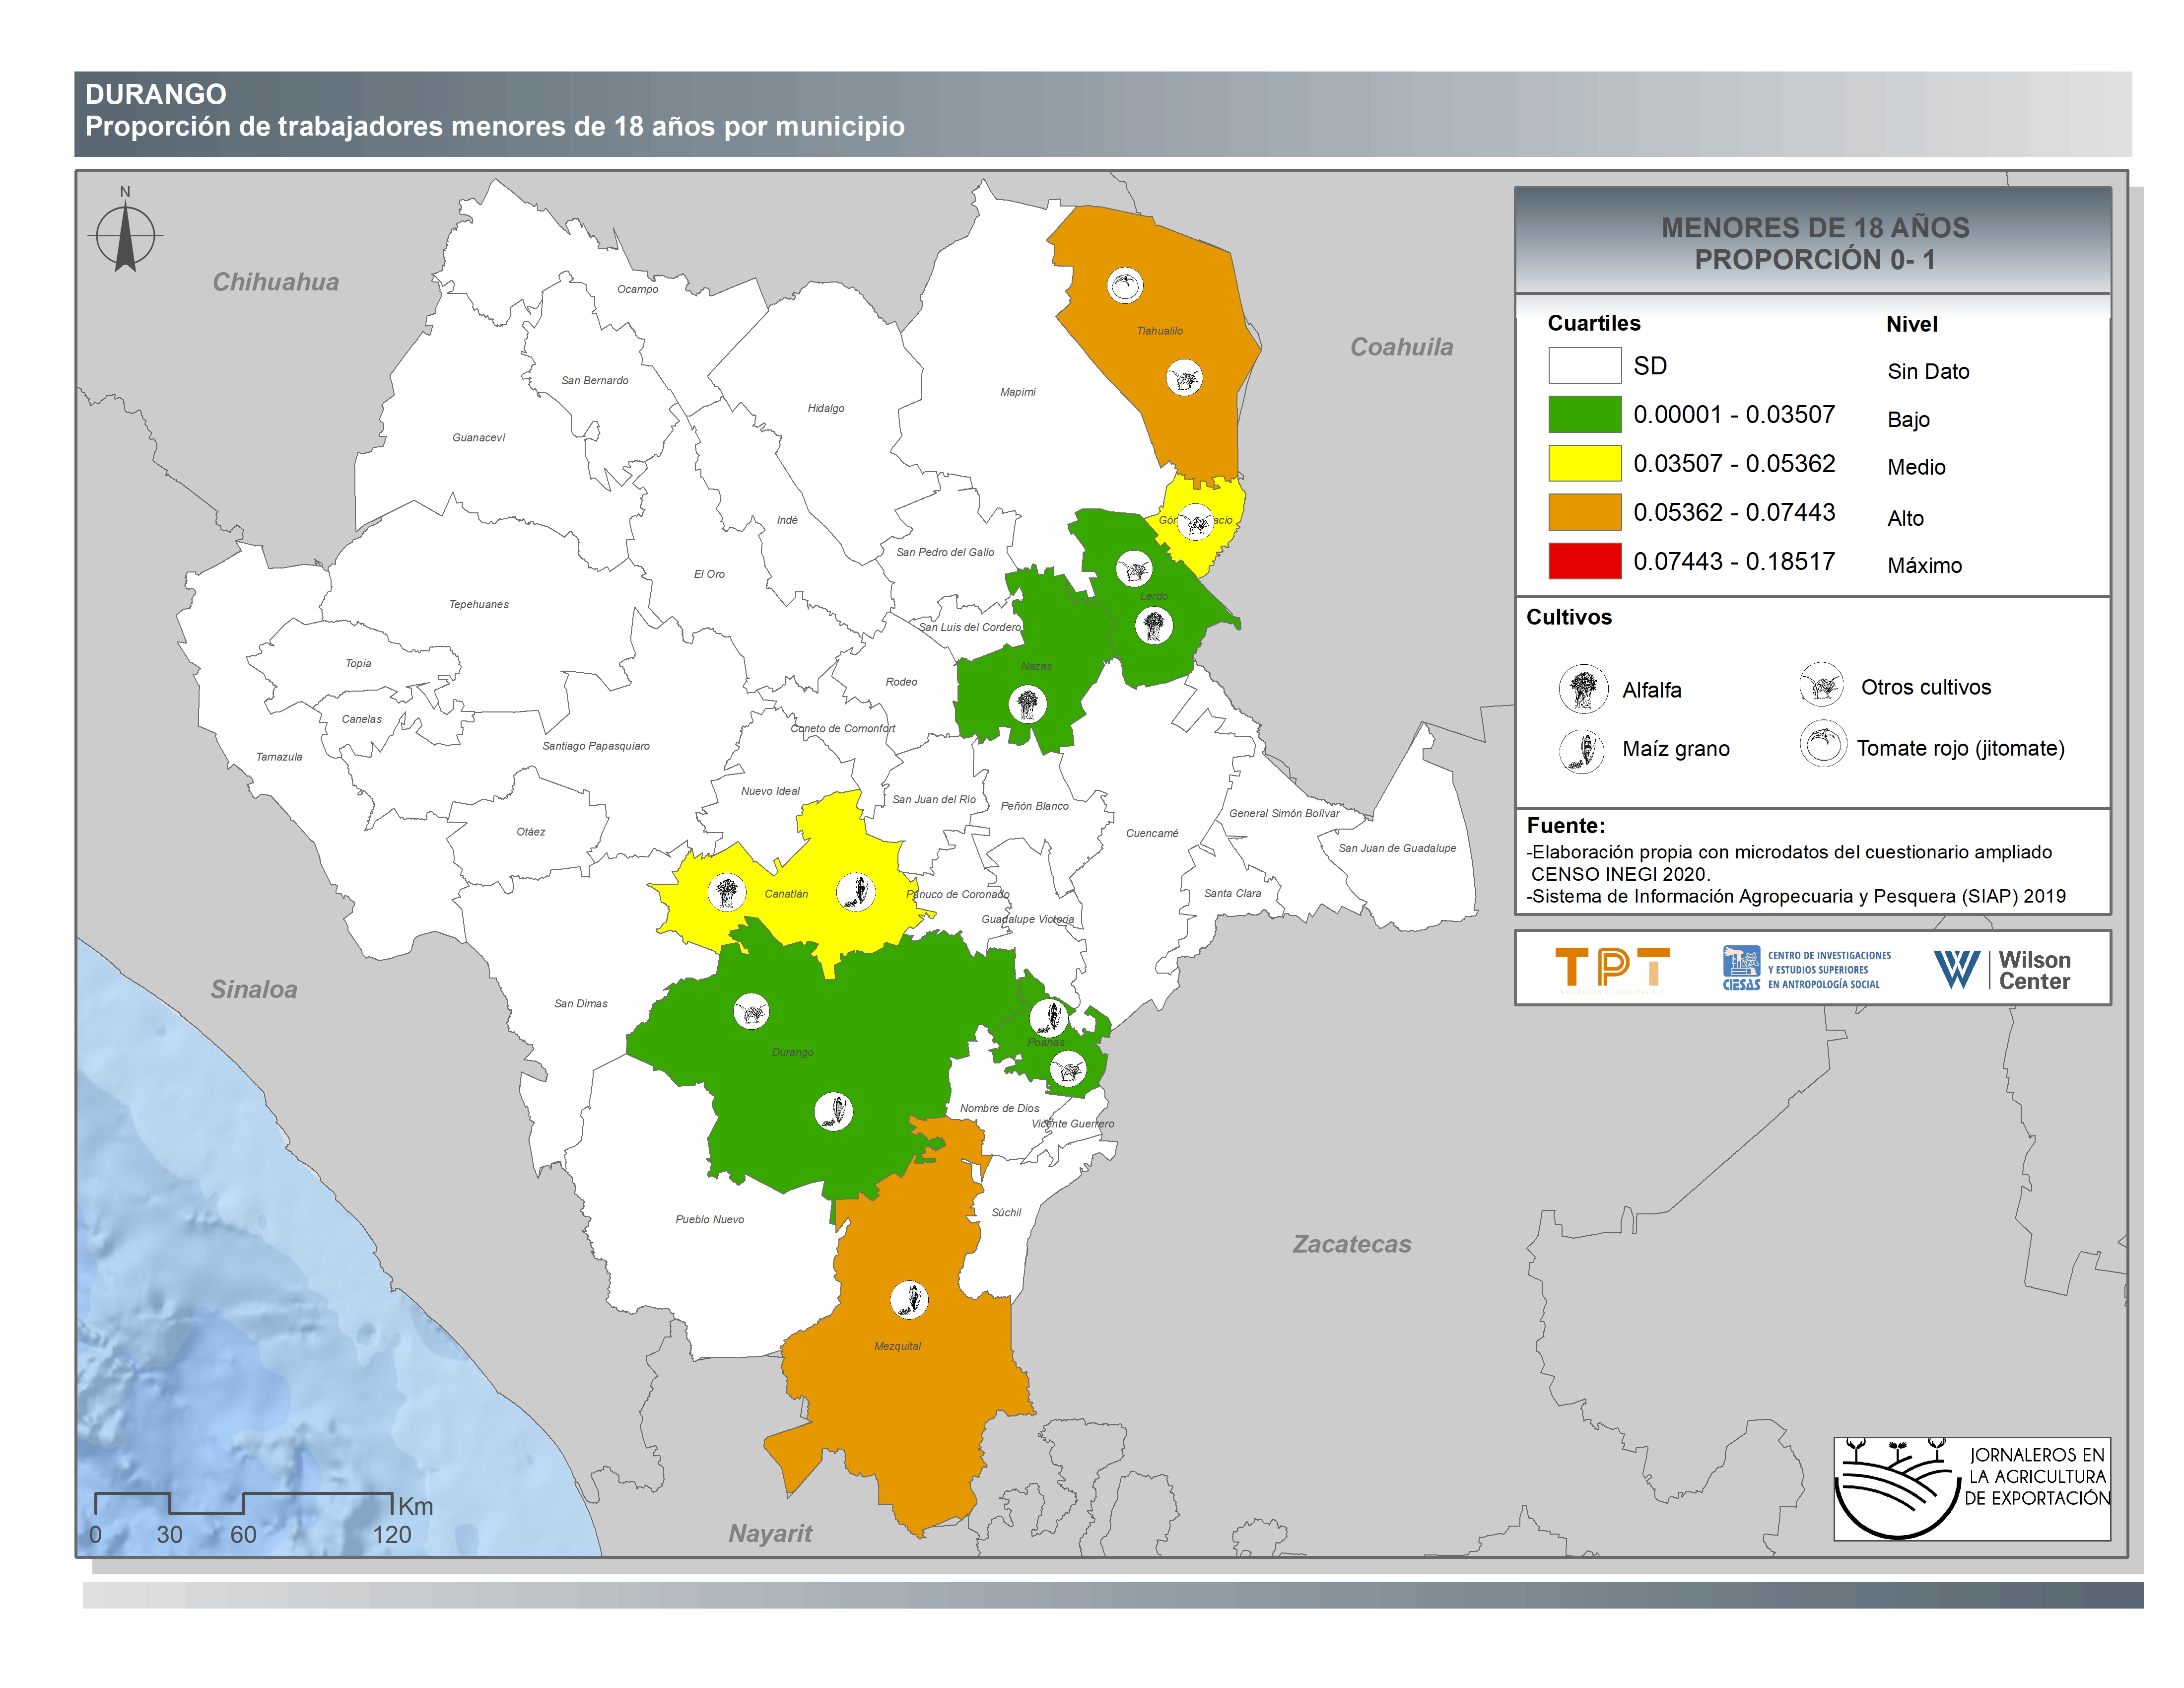
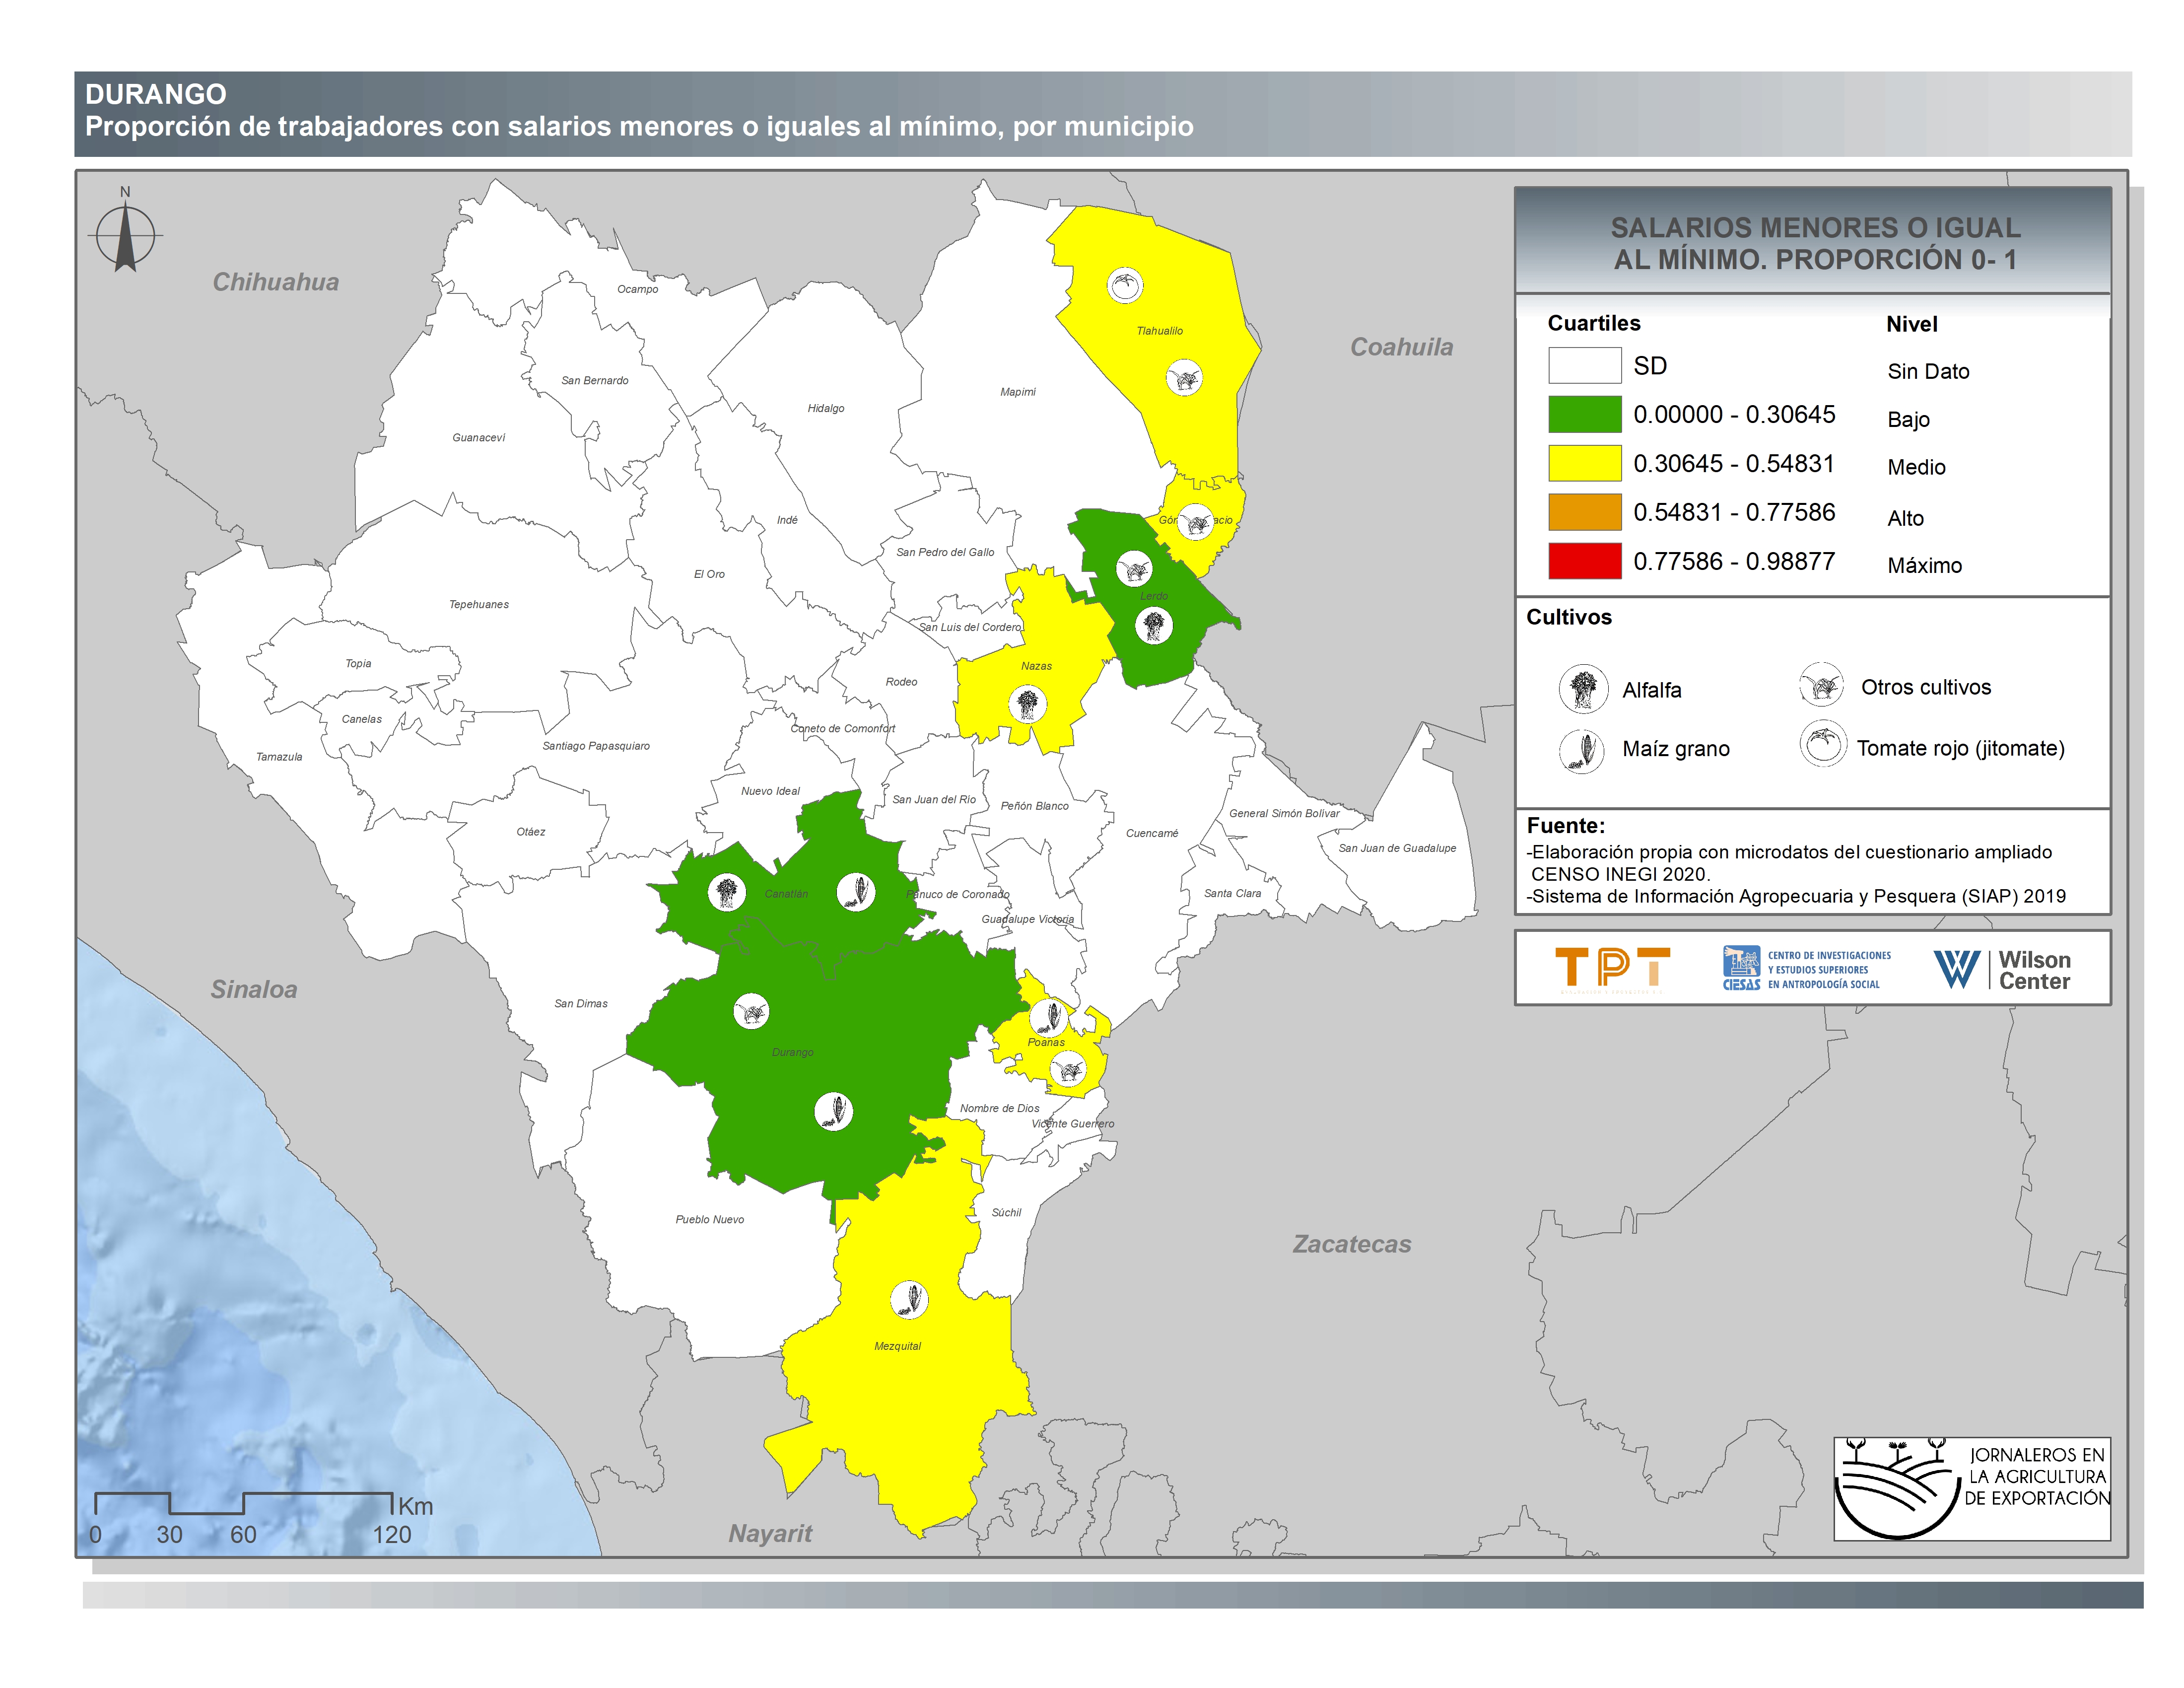
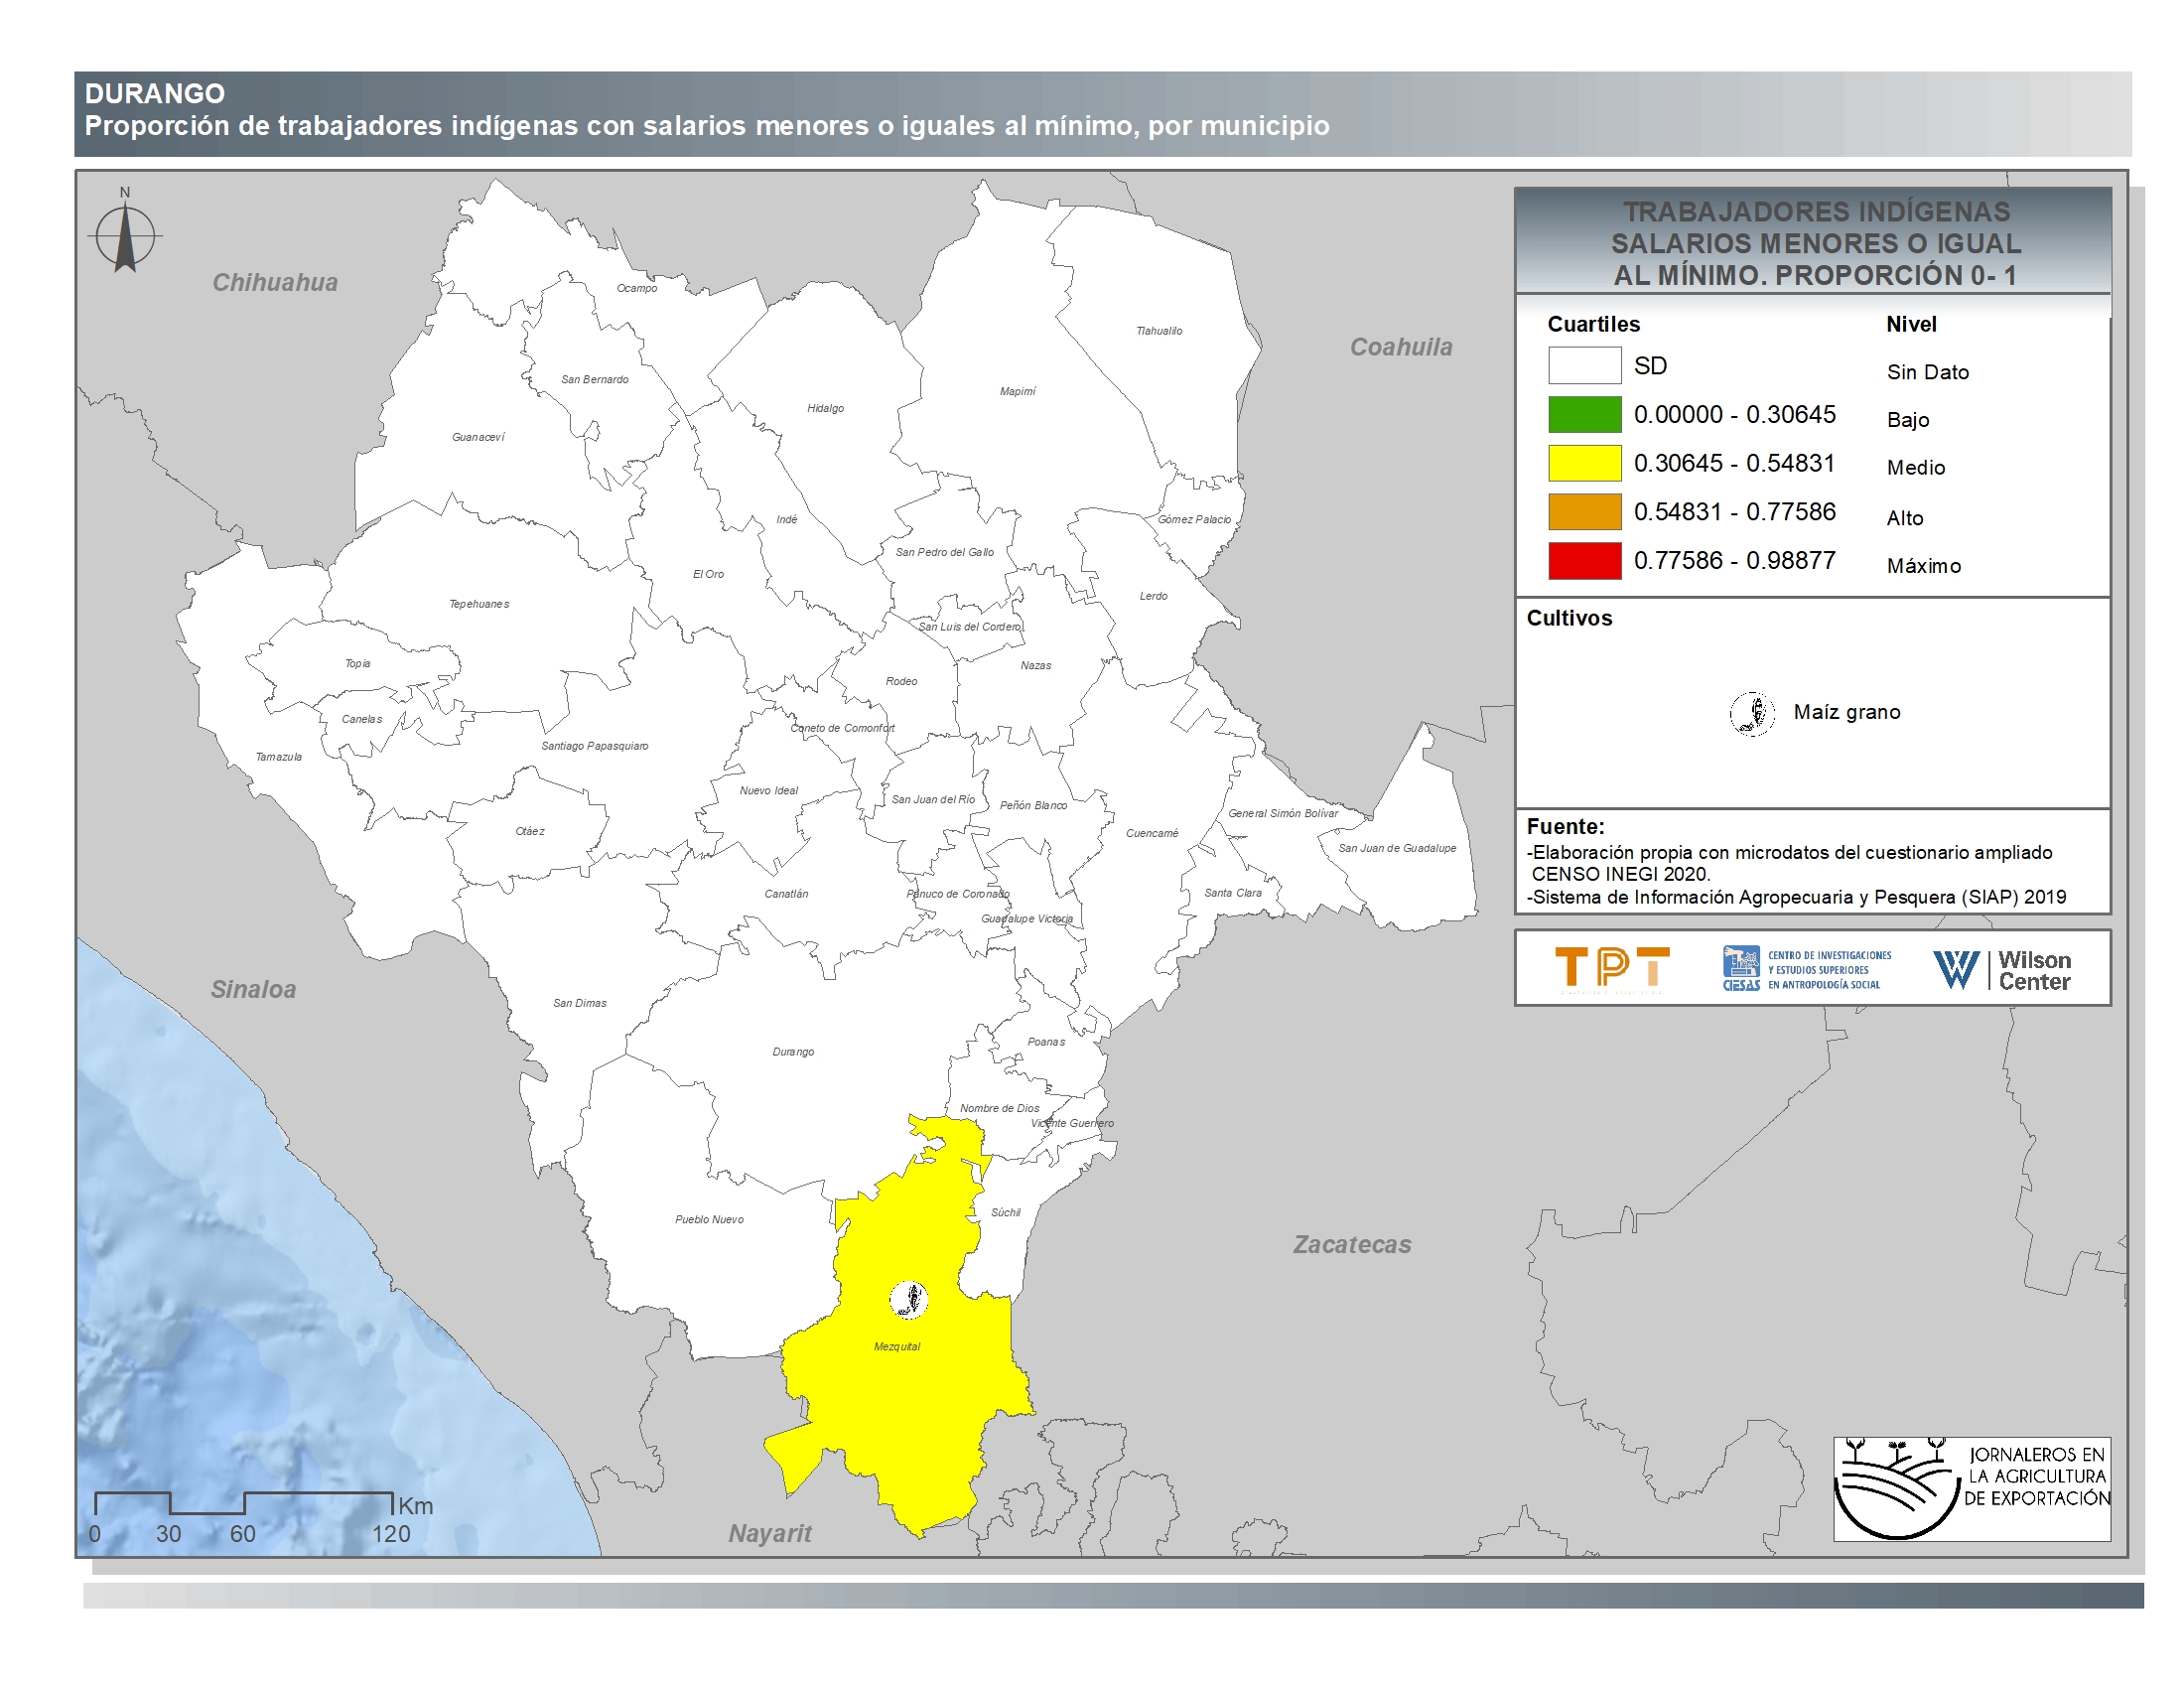
Durango
-
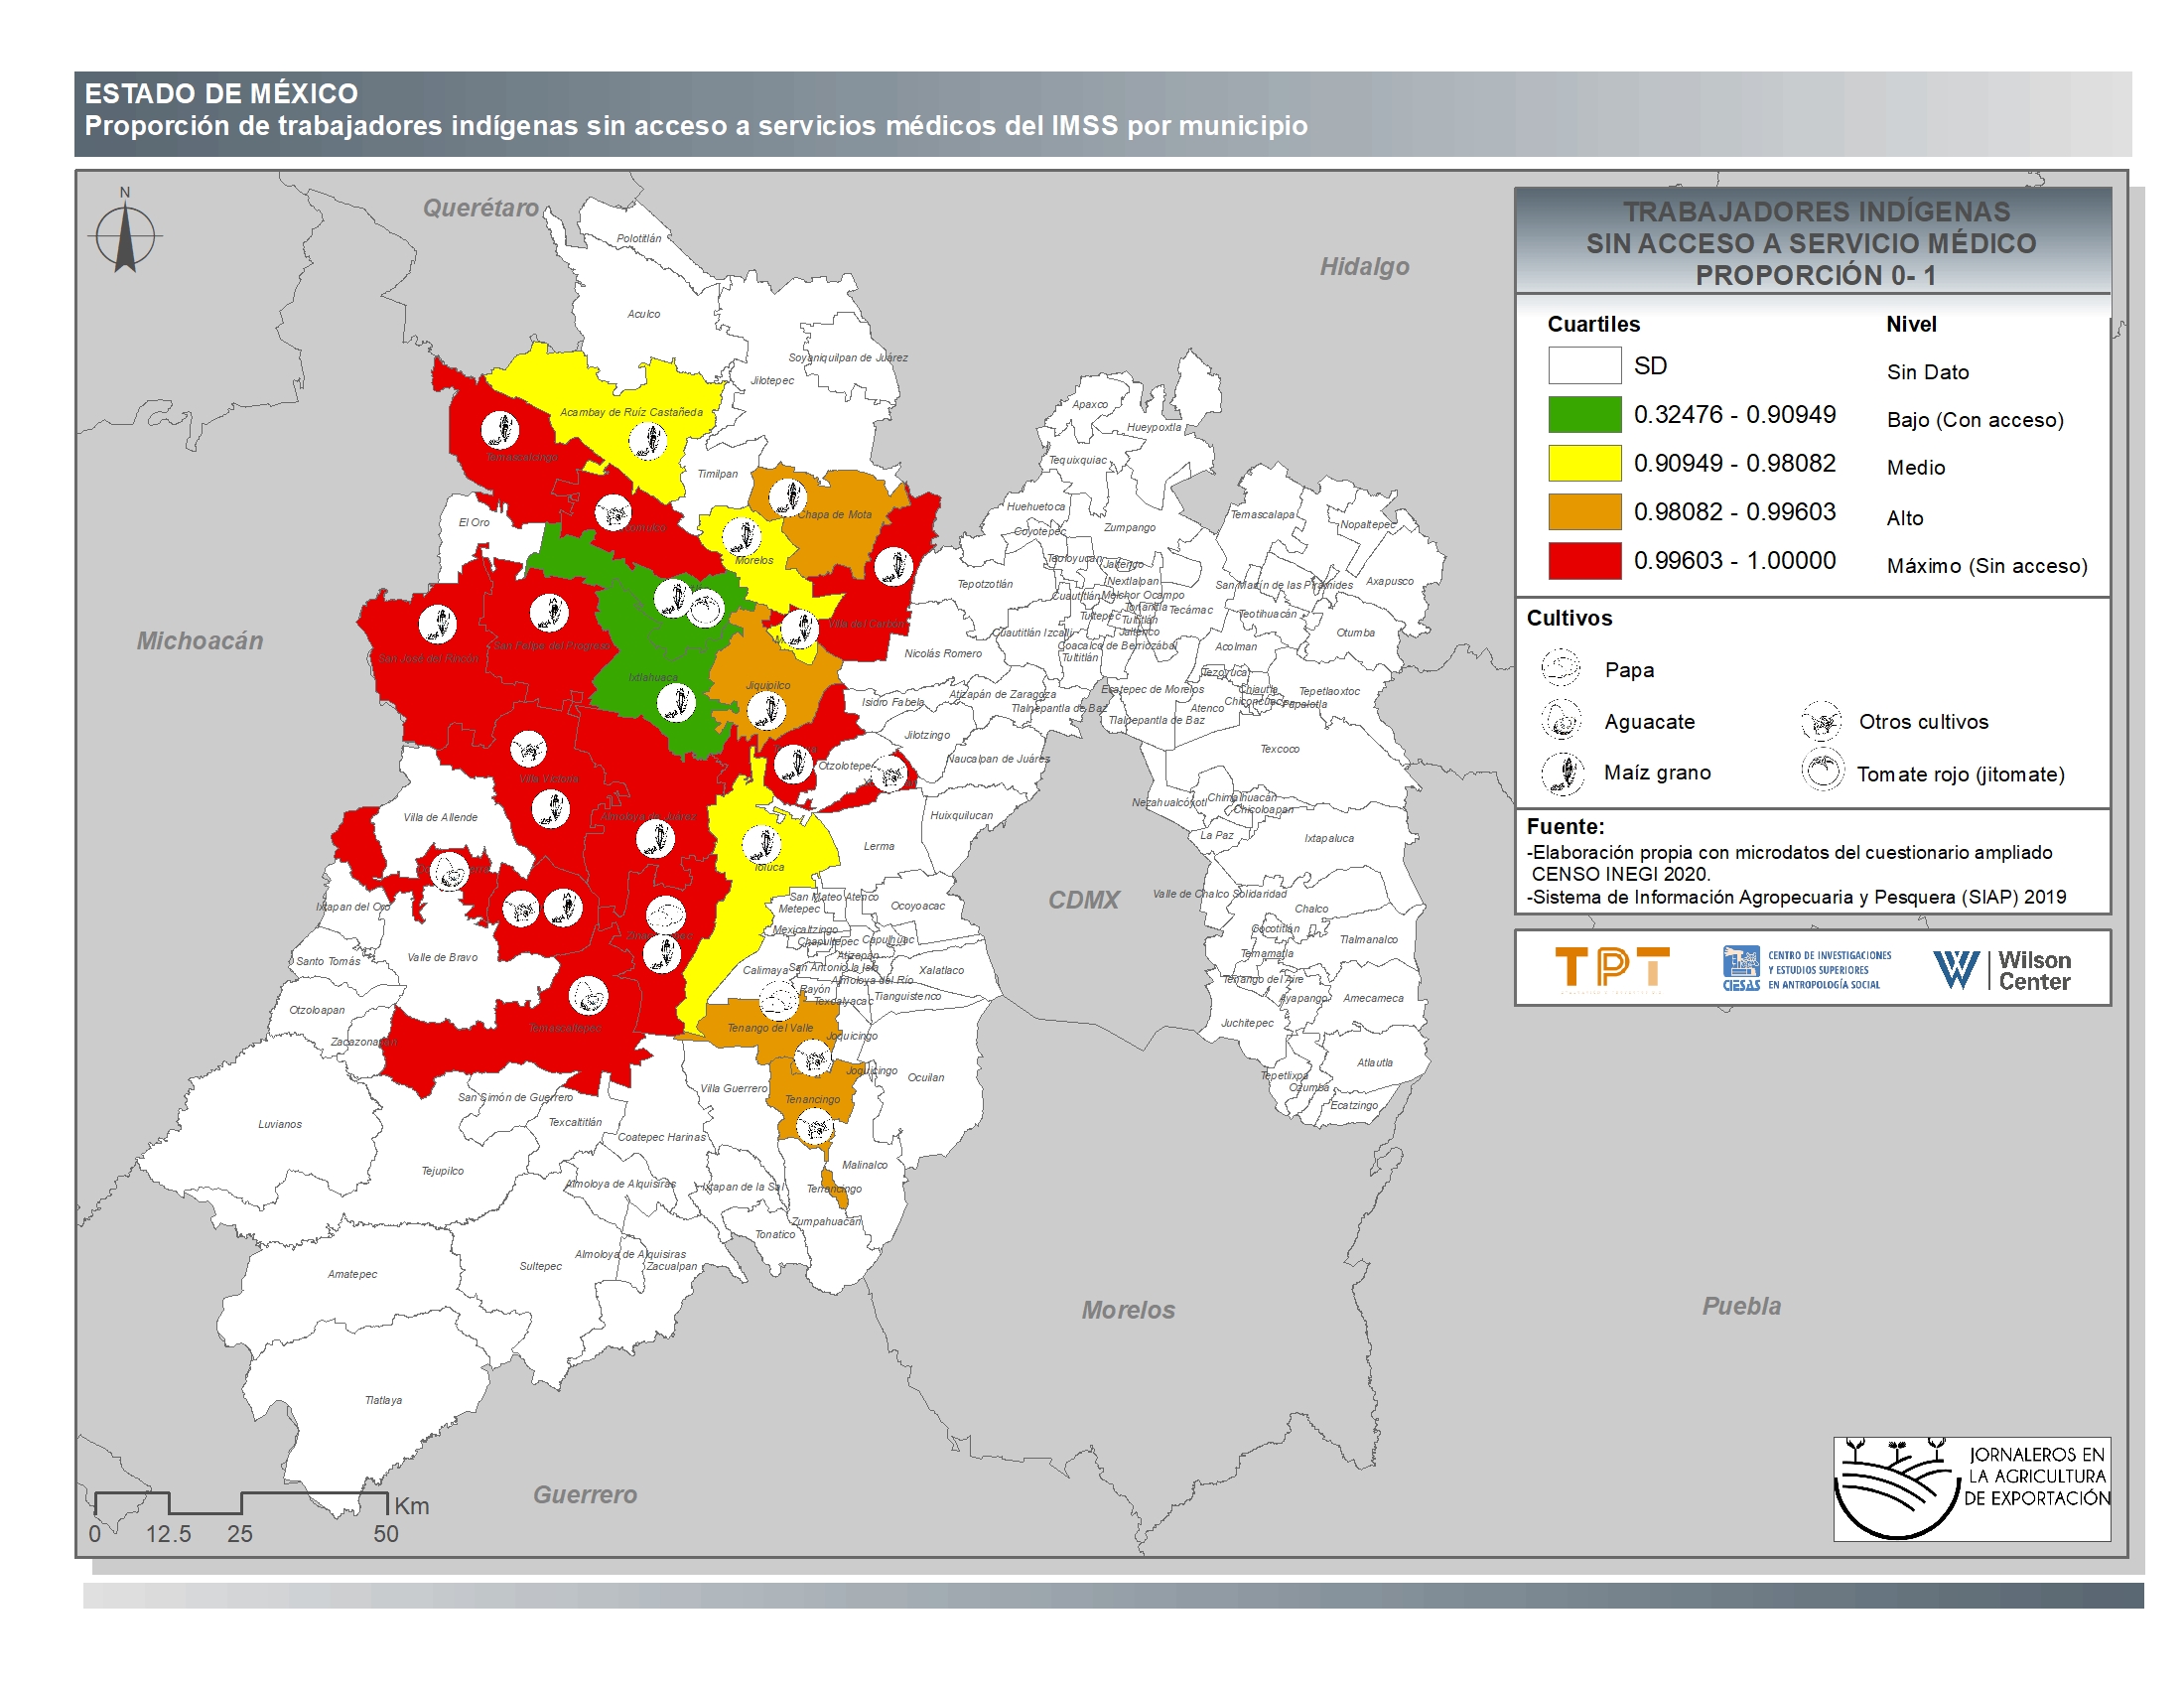
Estado de México
-
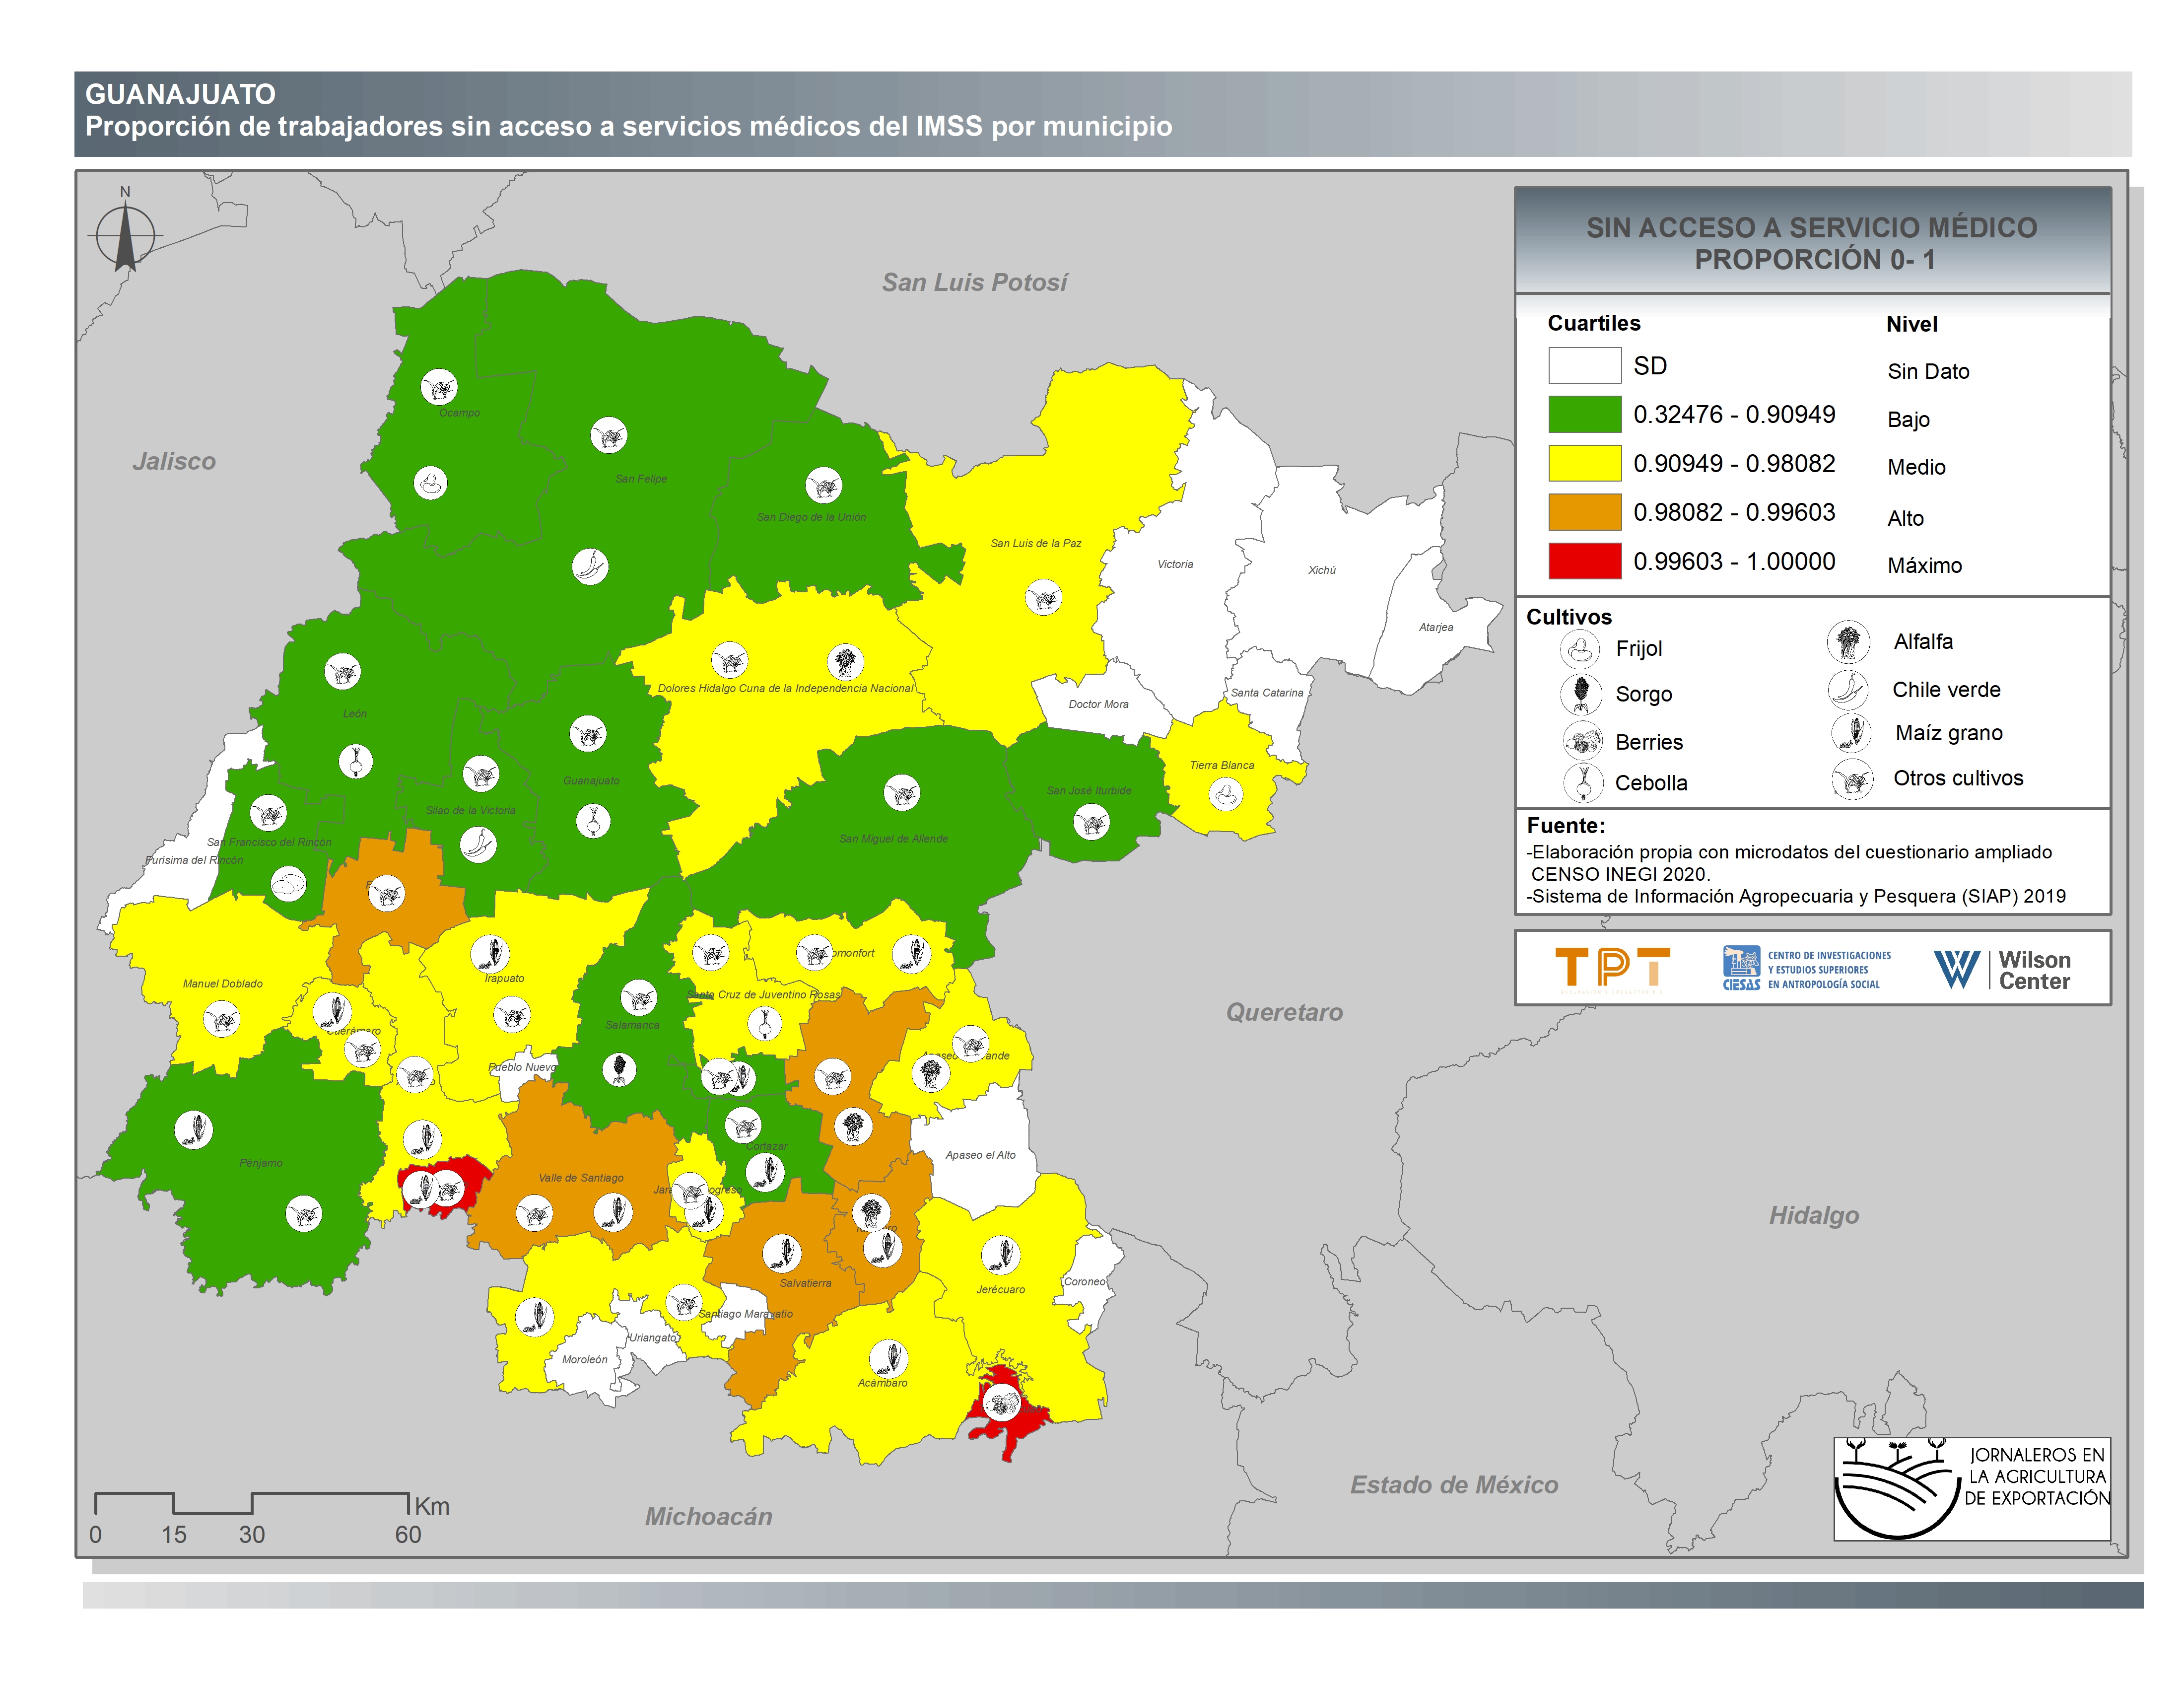
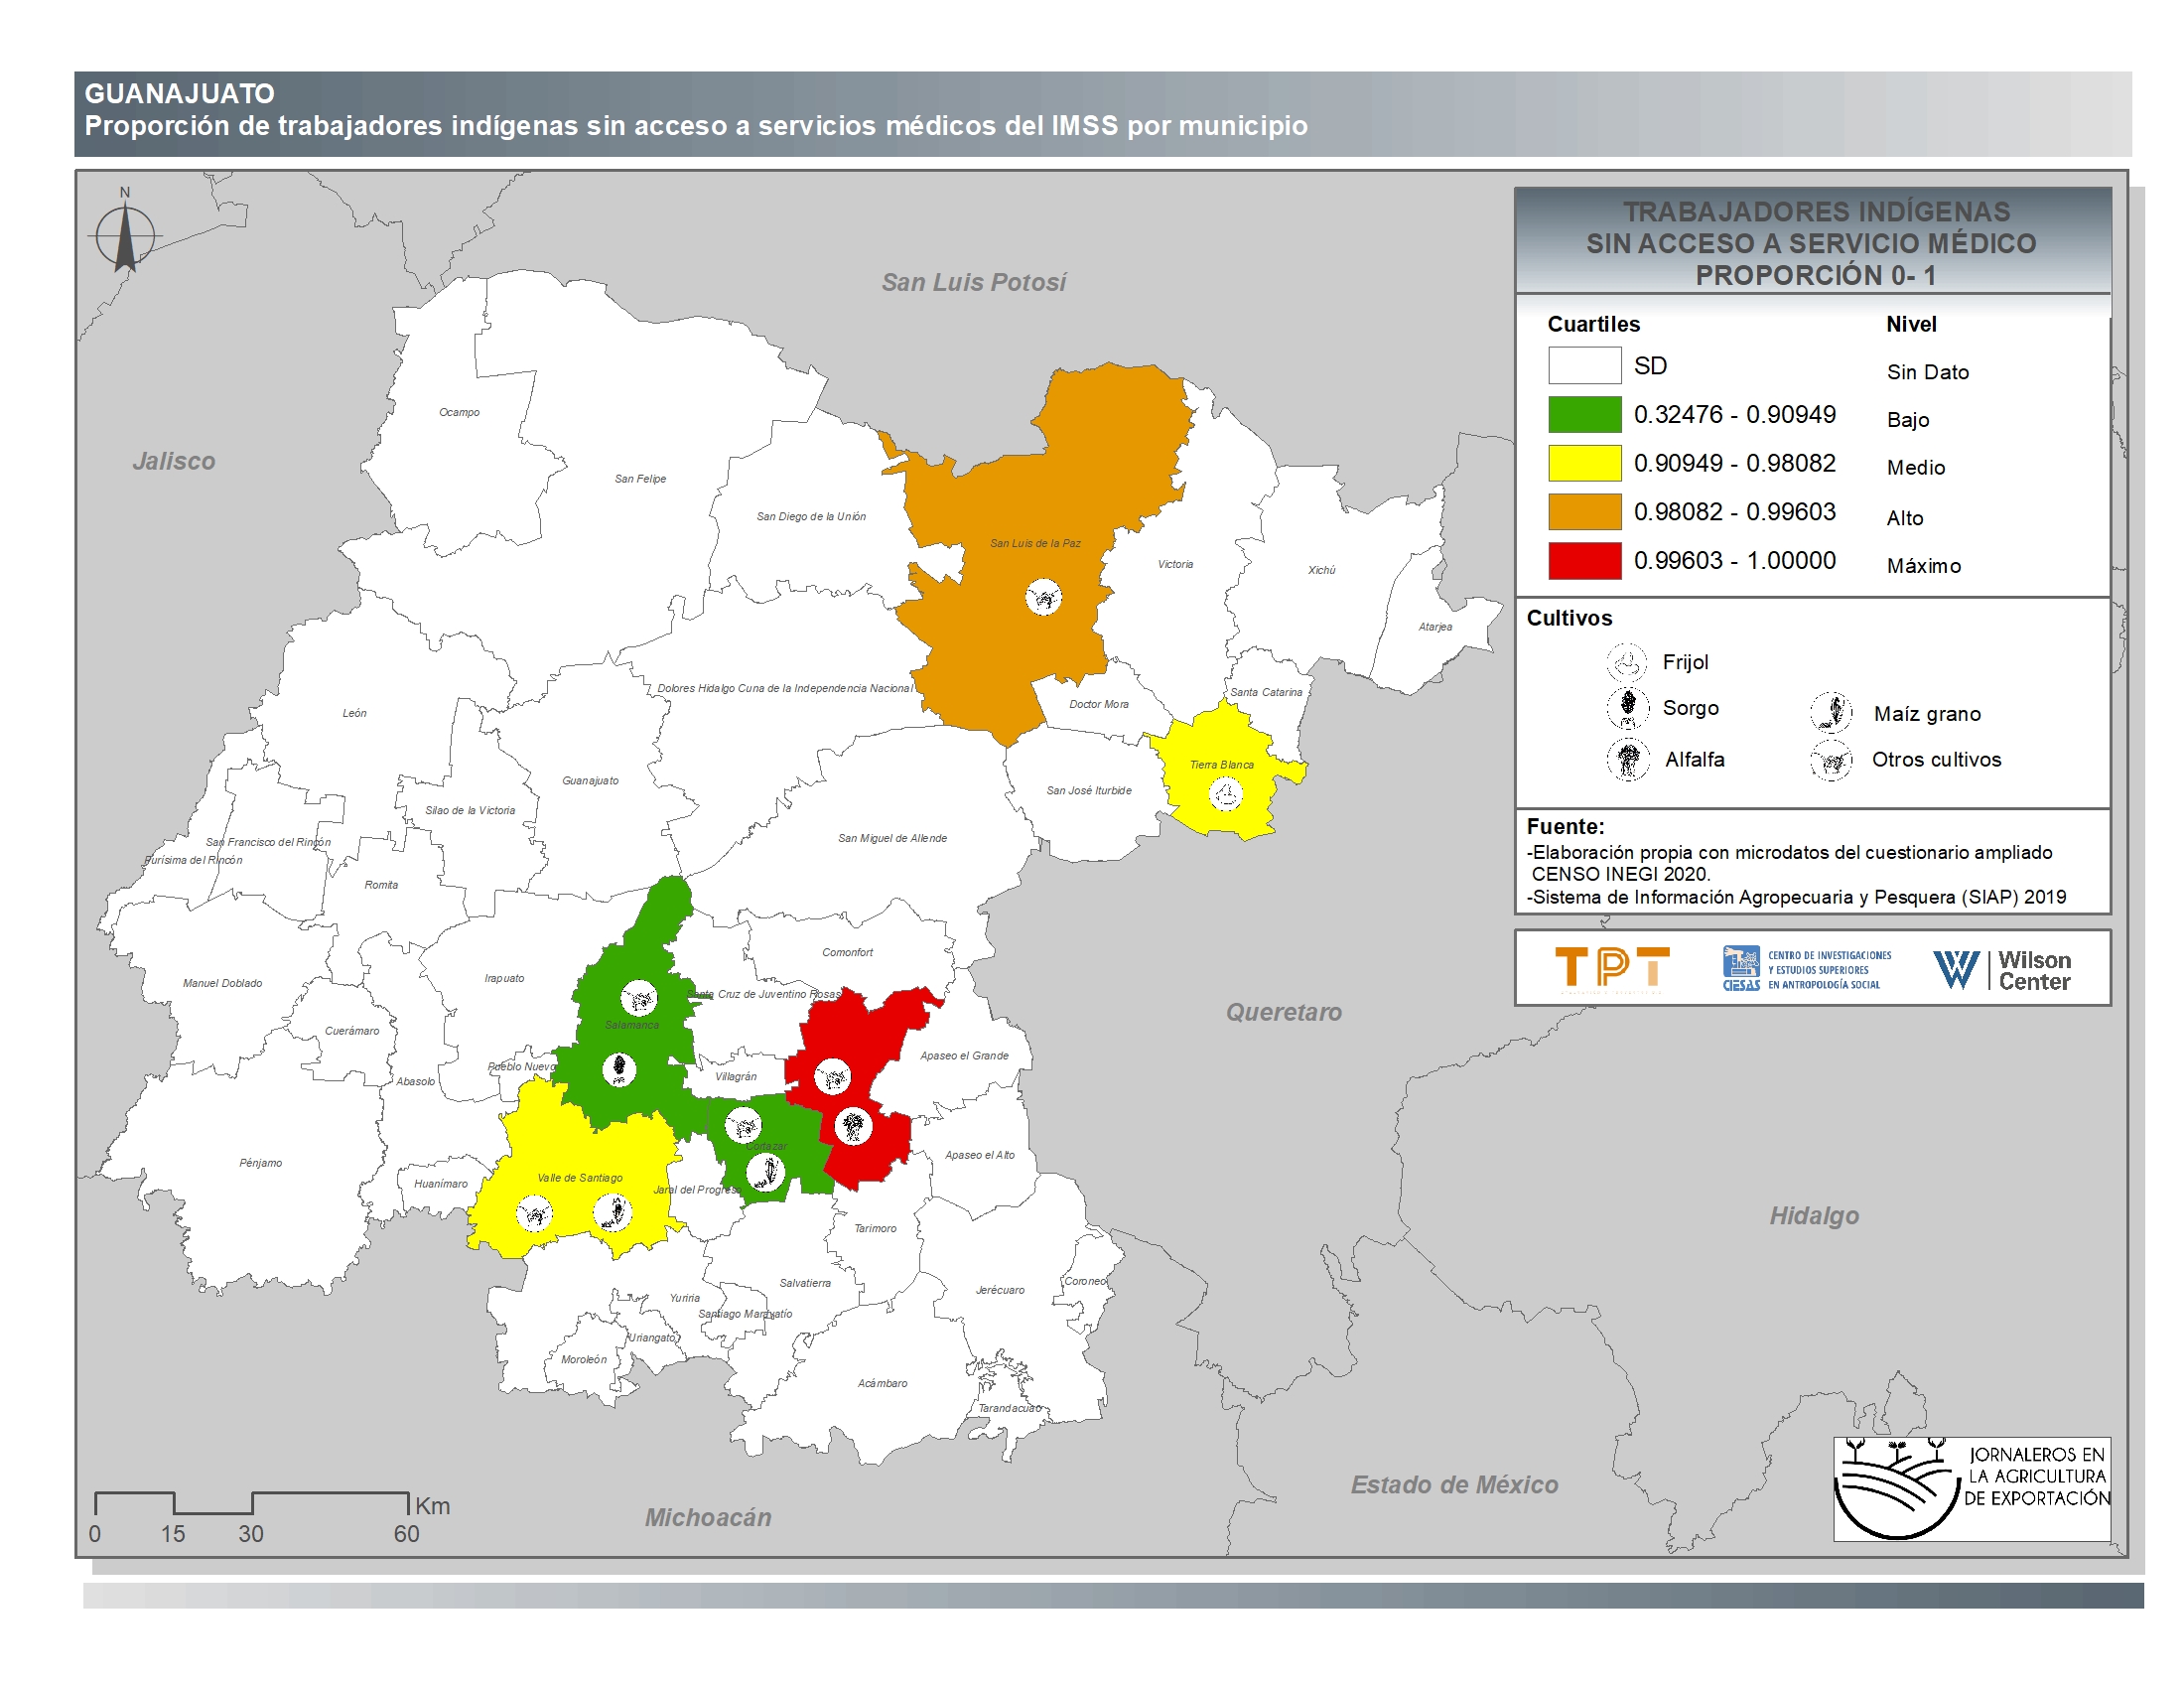
Guanajuato
-
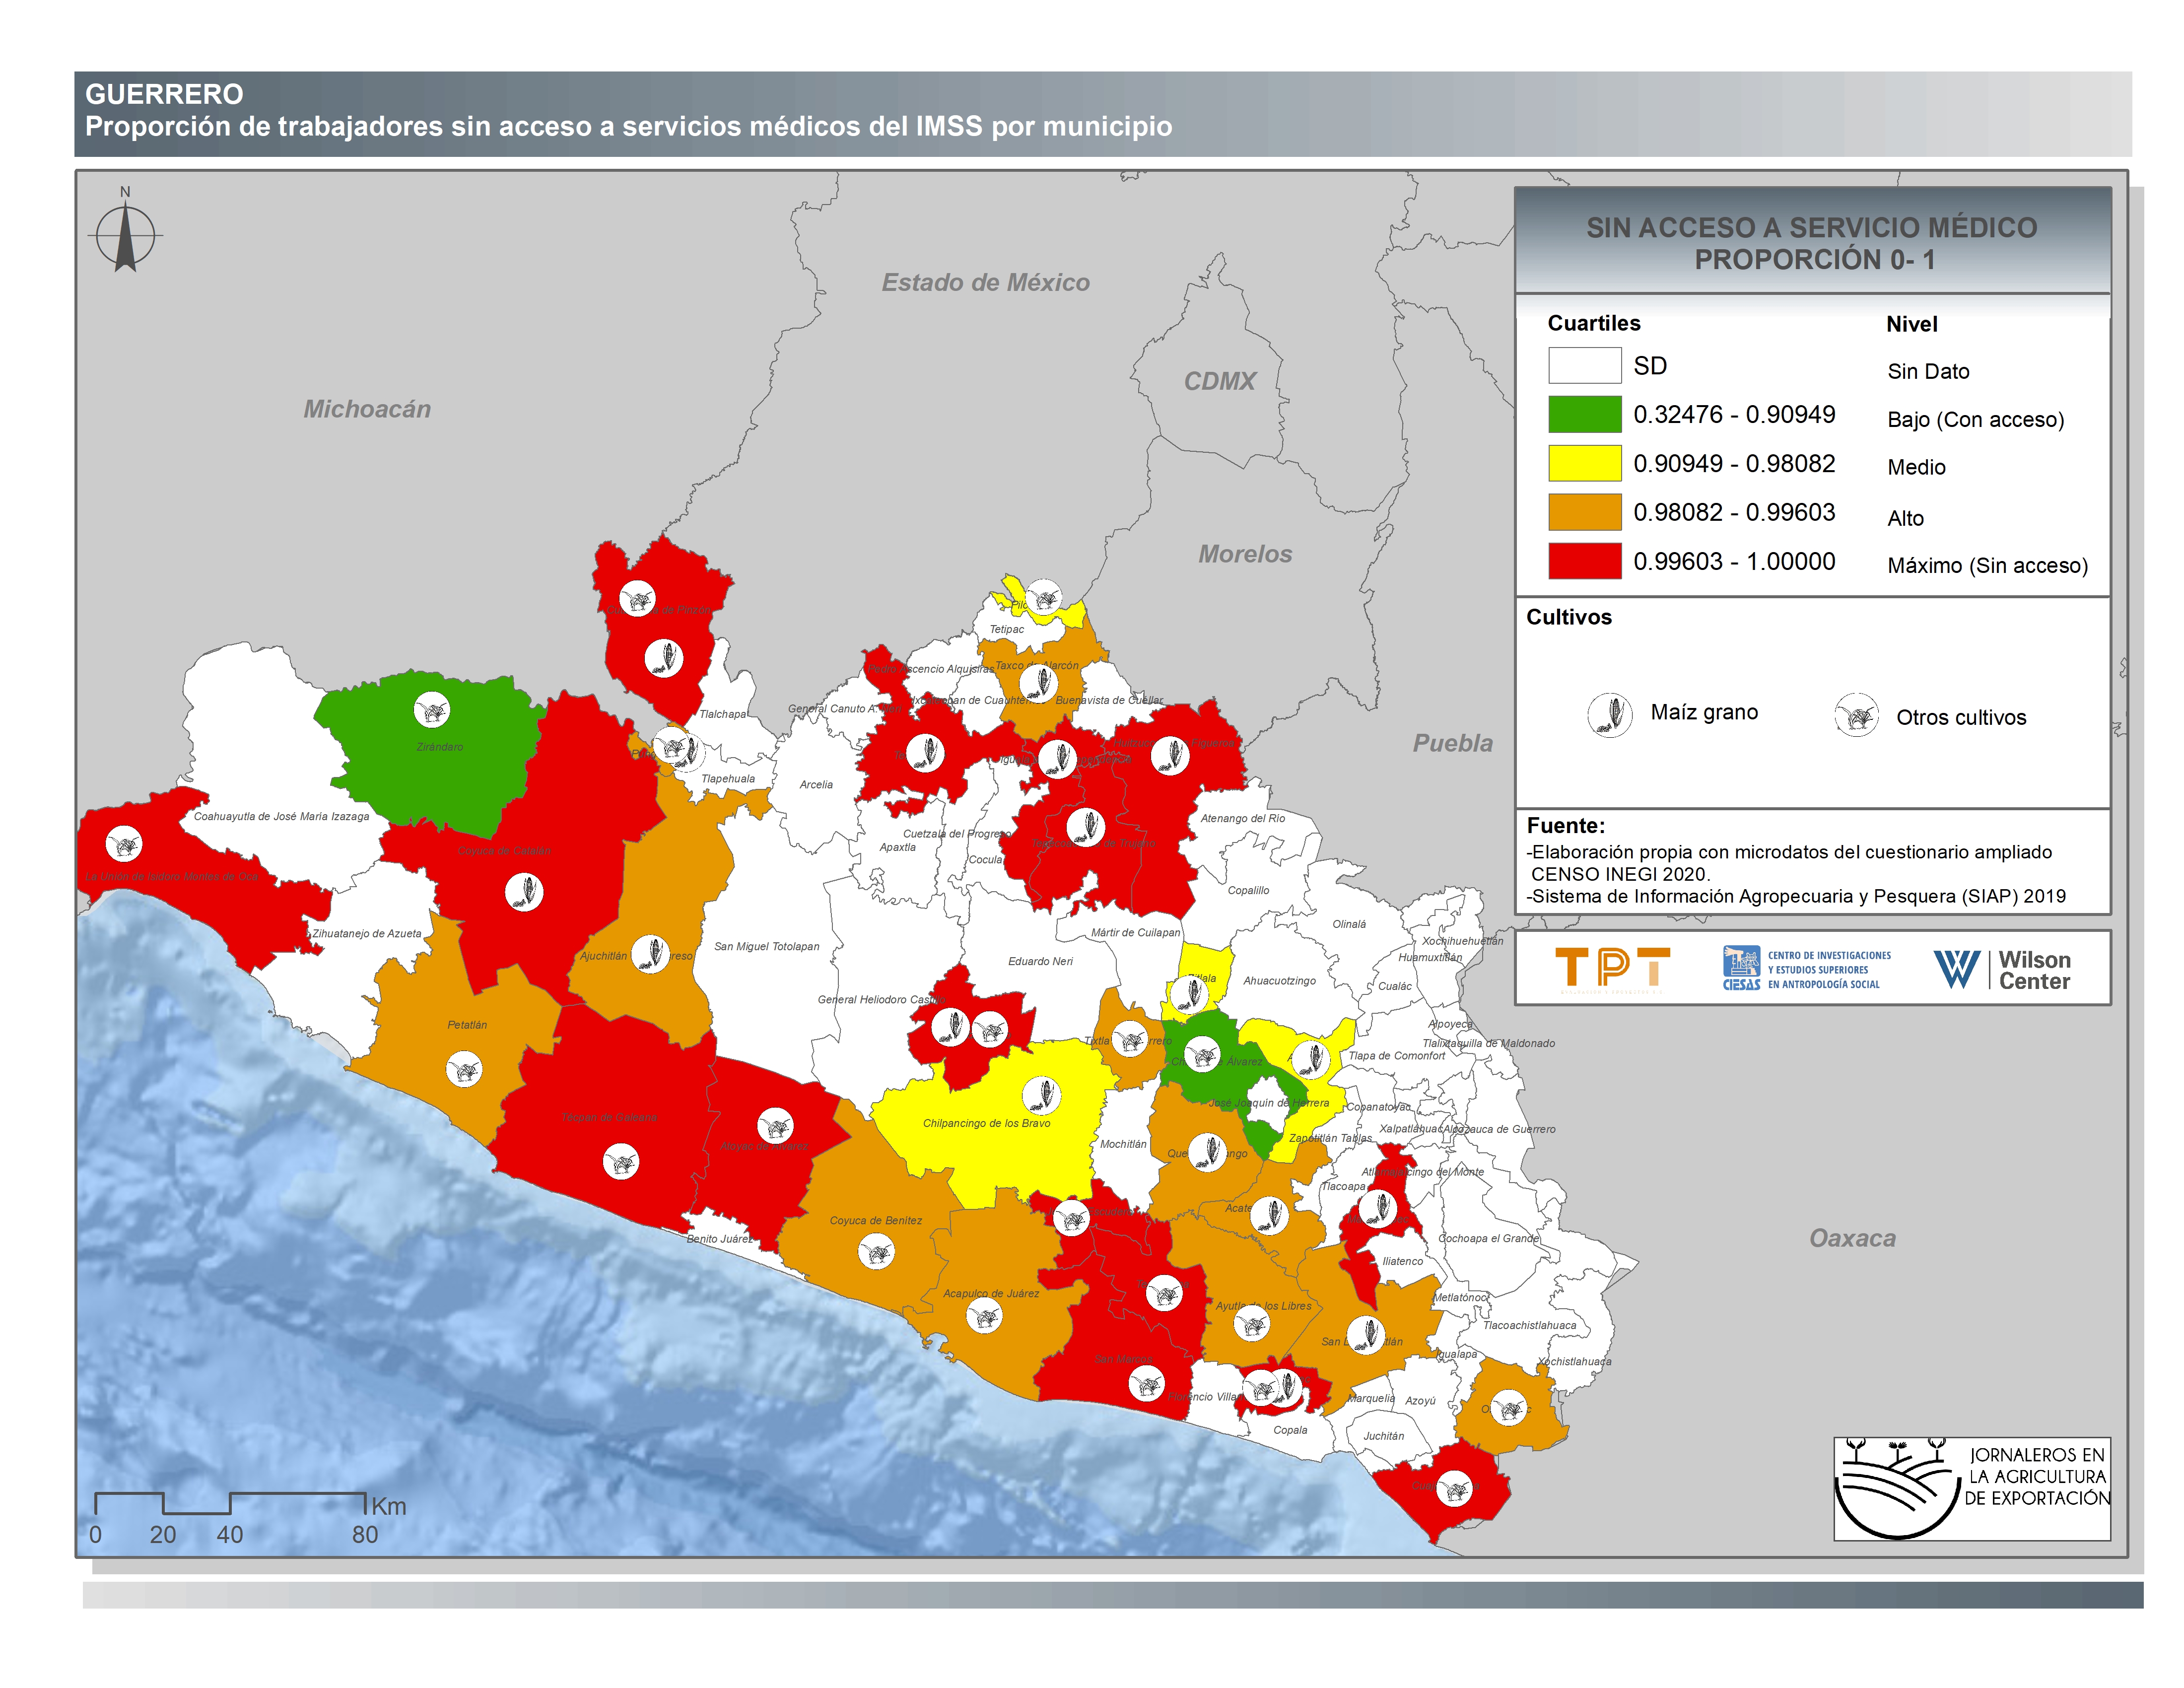
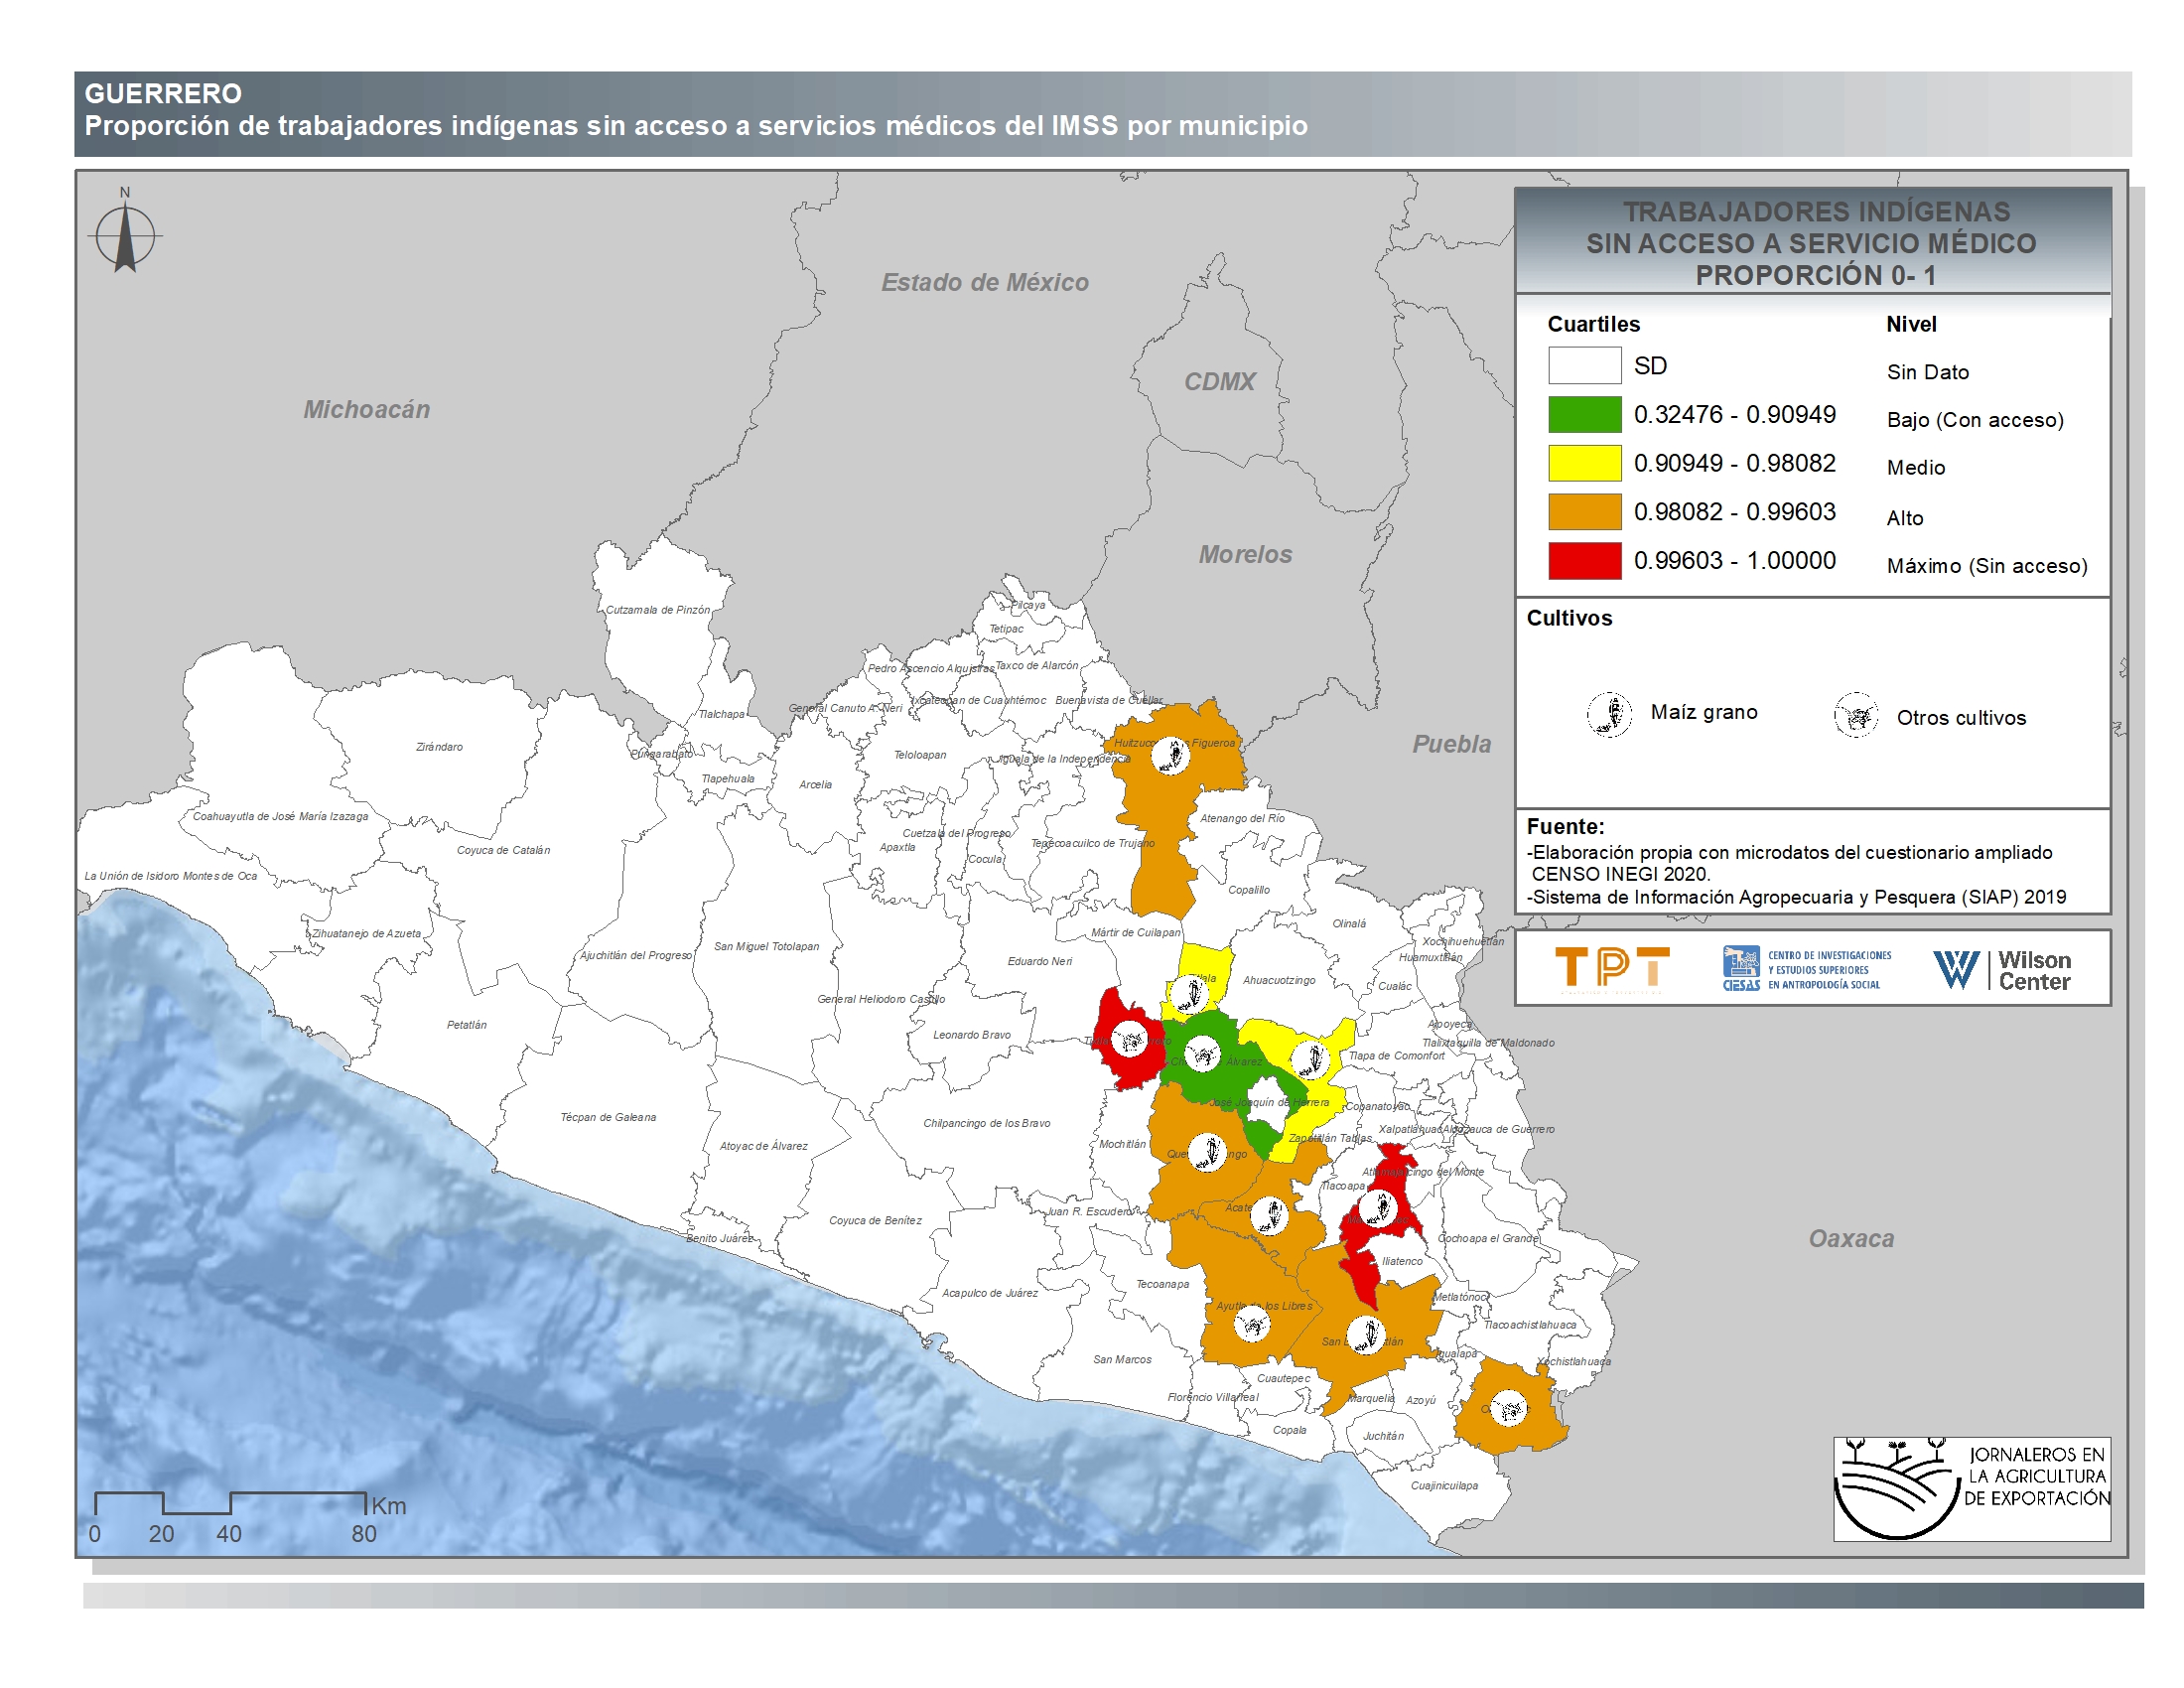
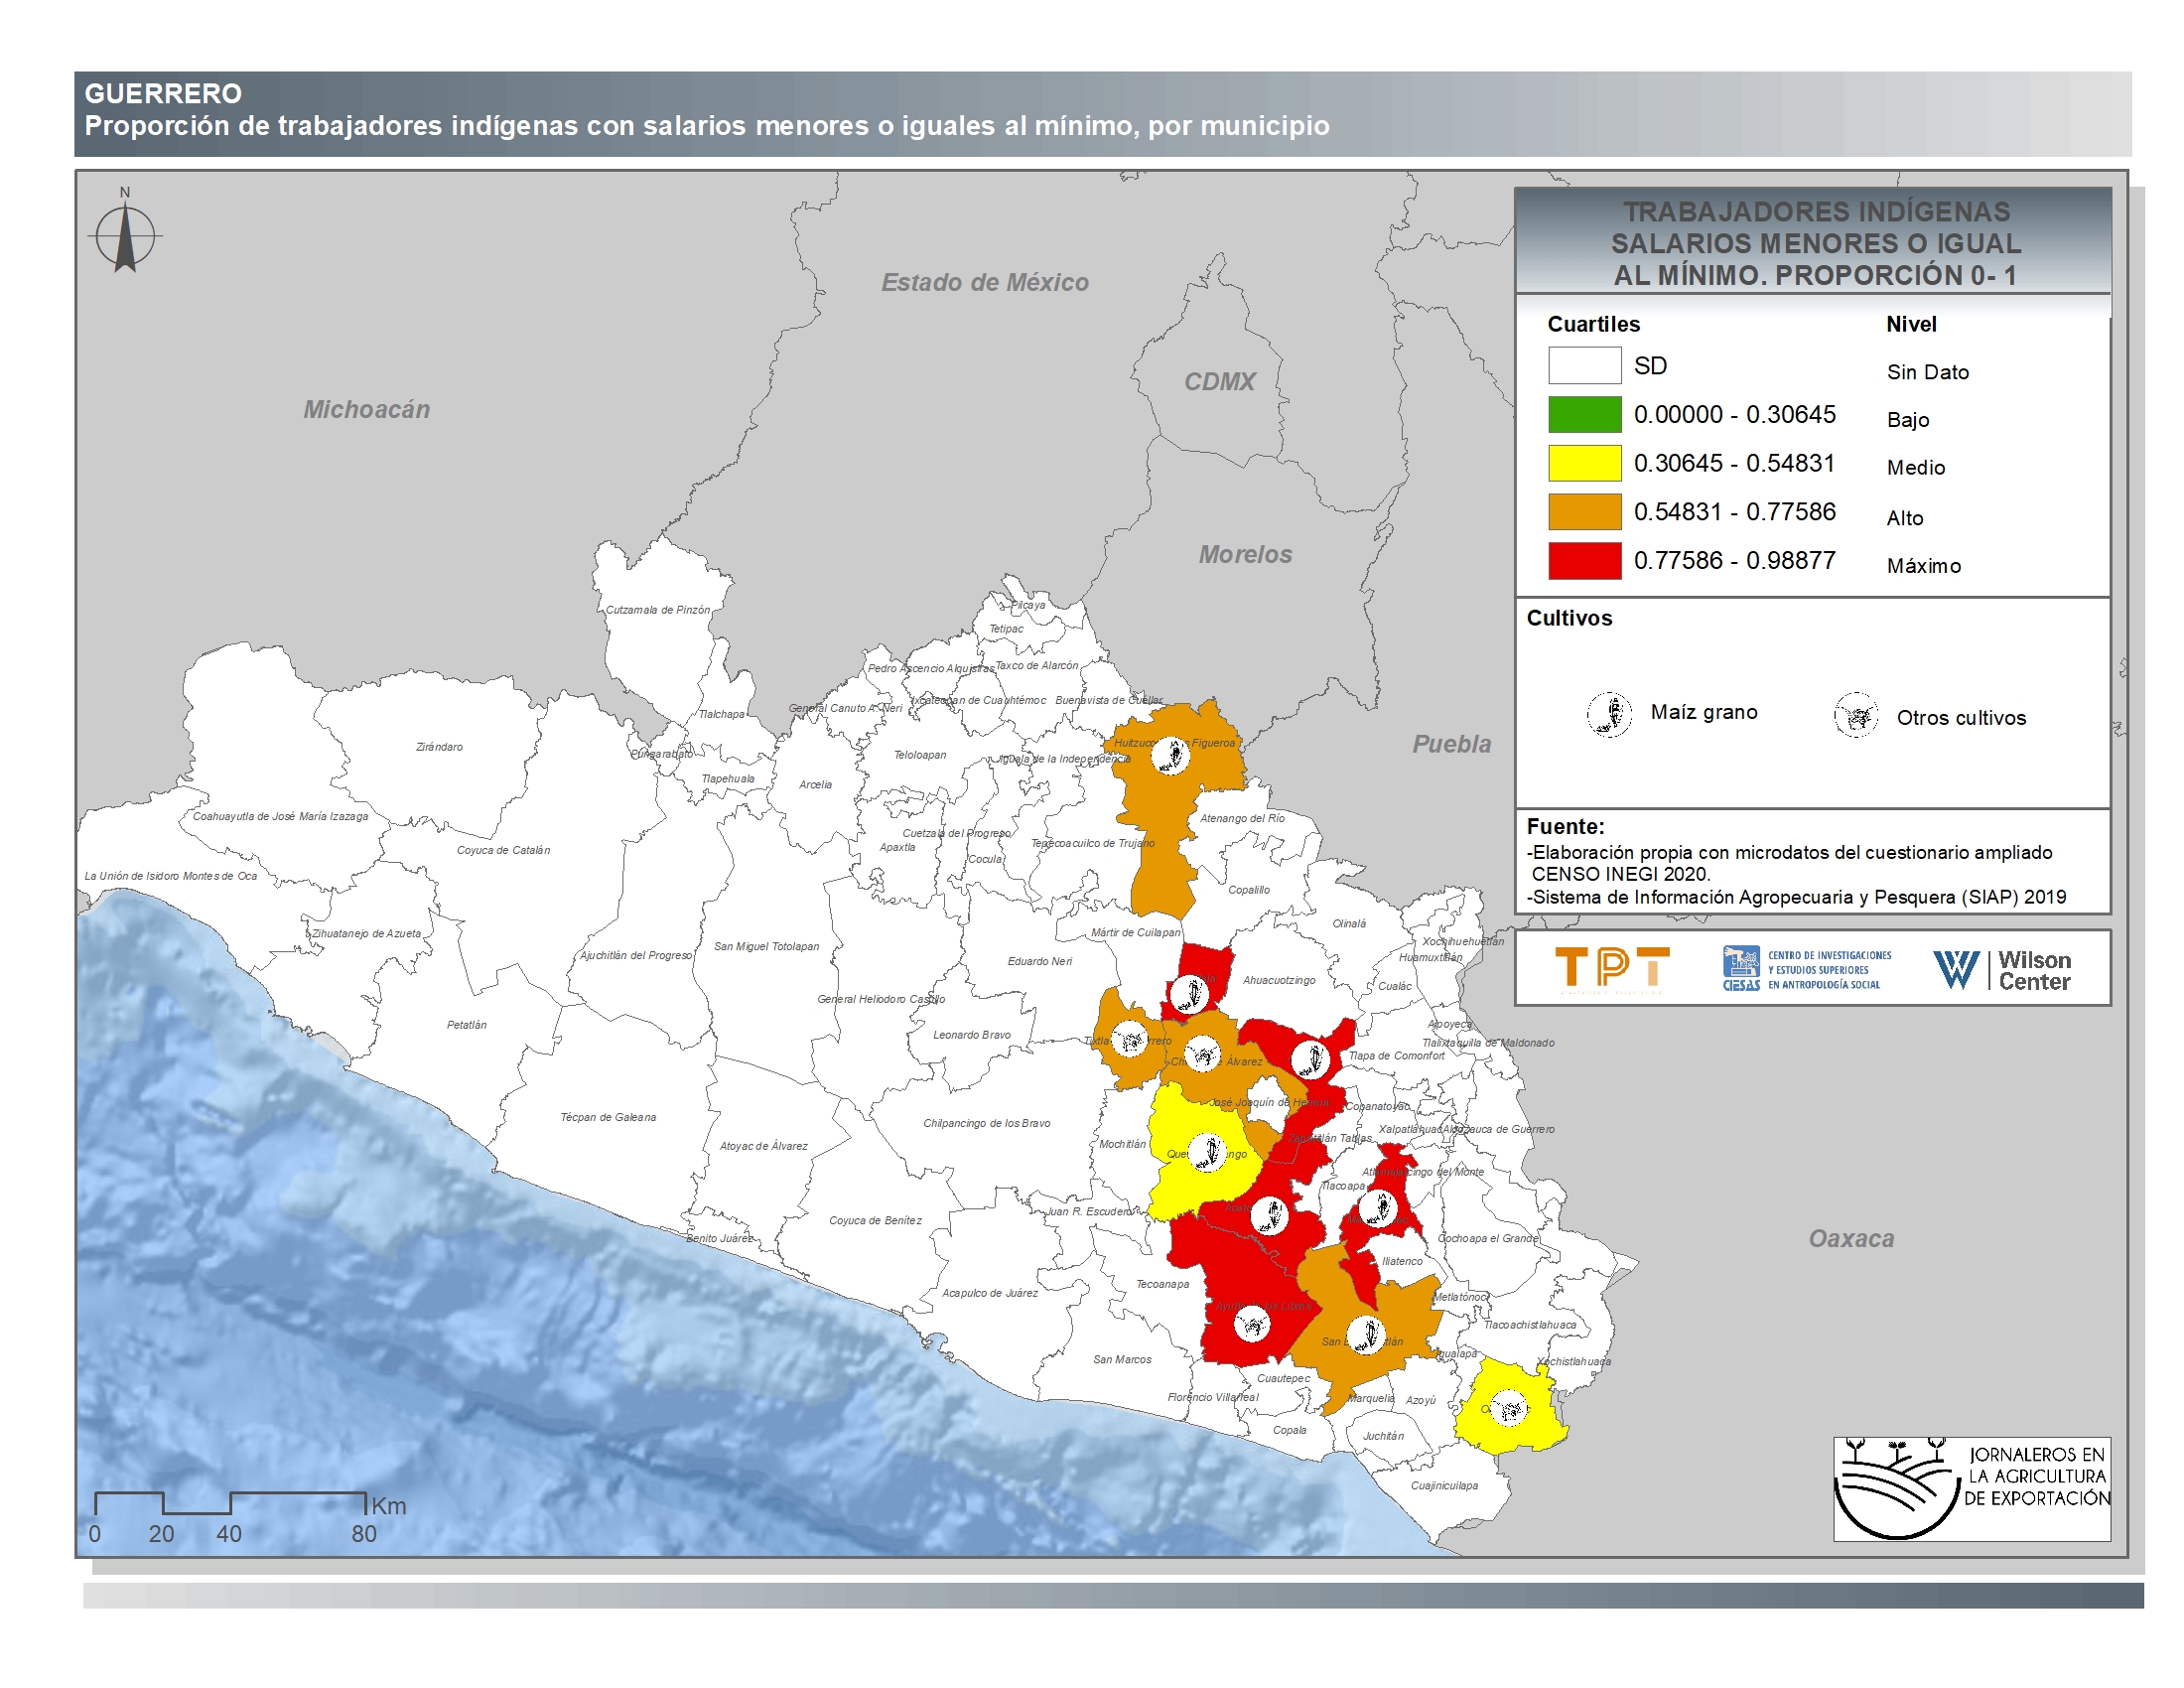
Guerrero
-
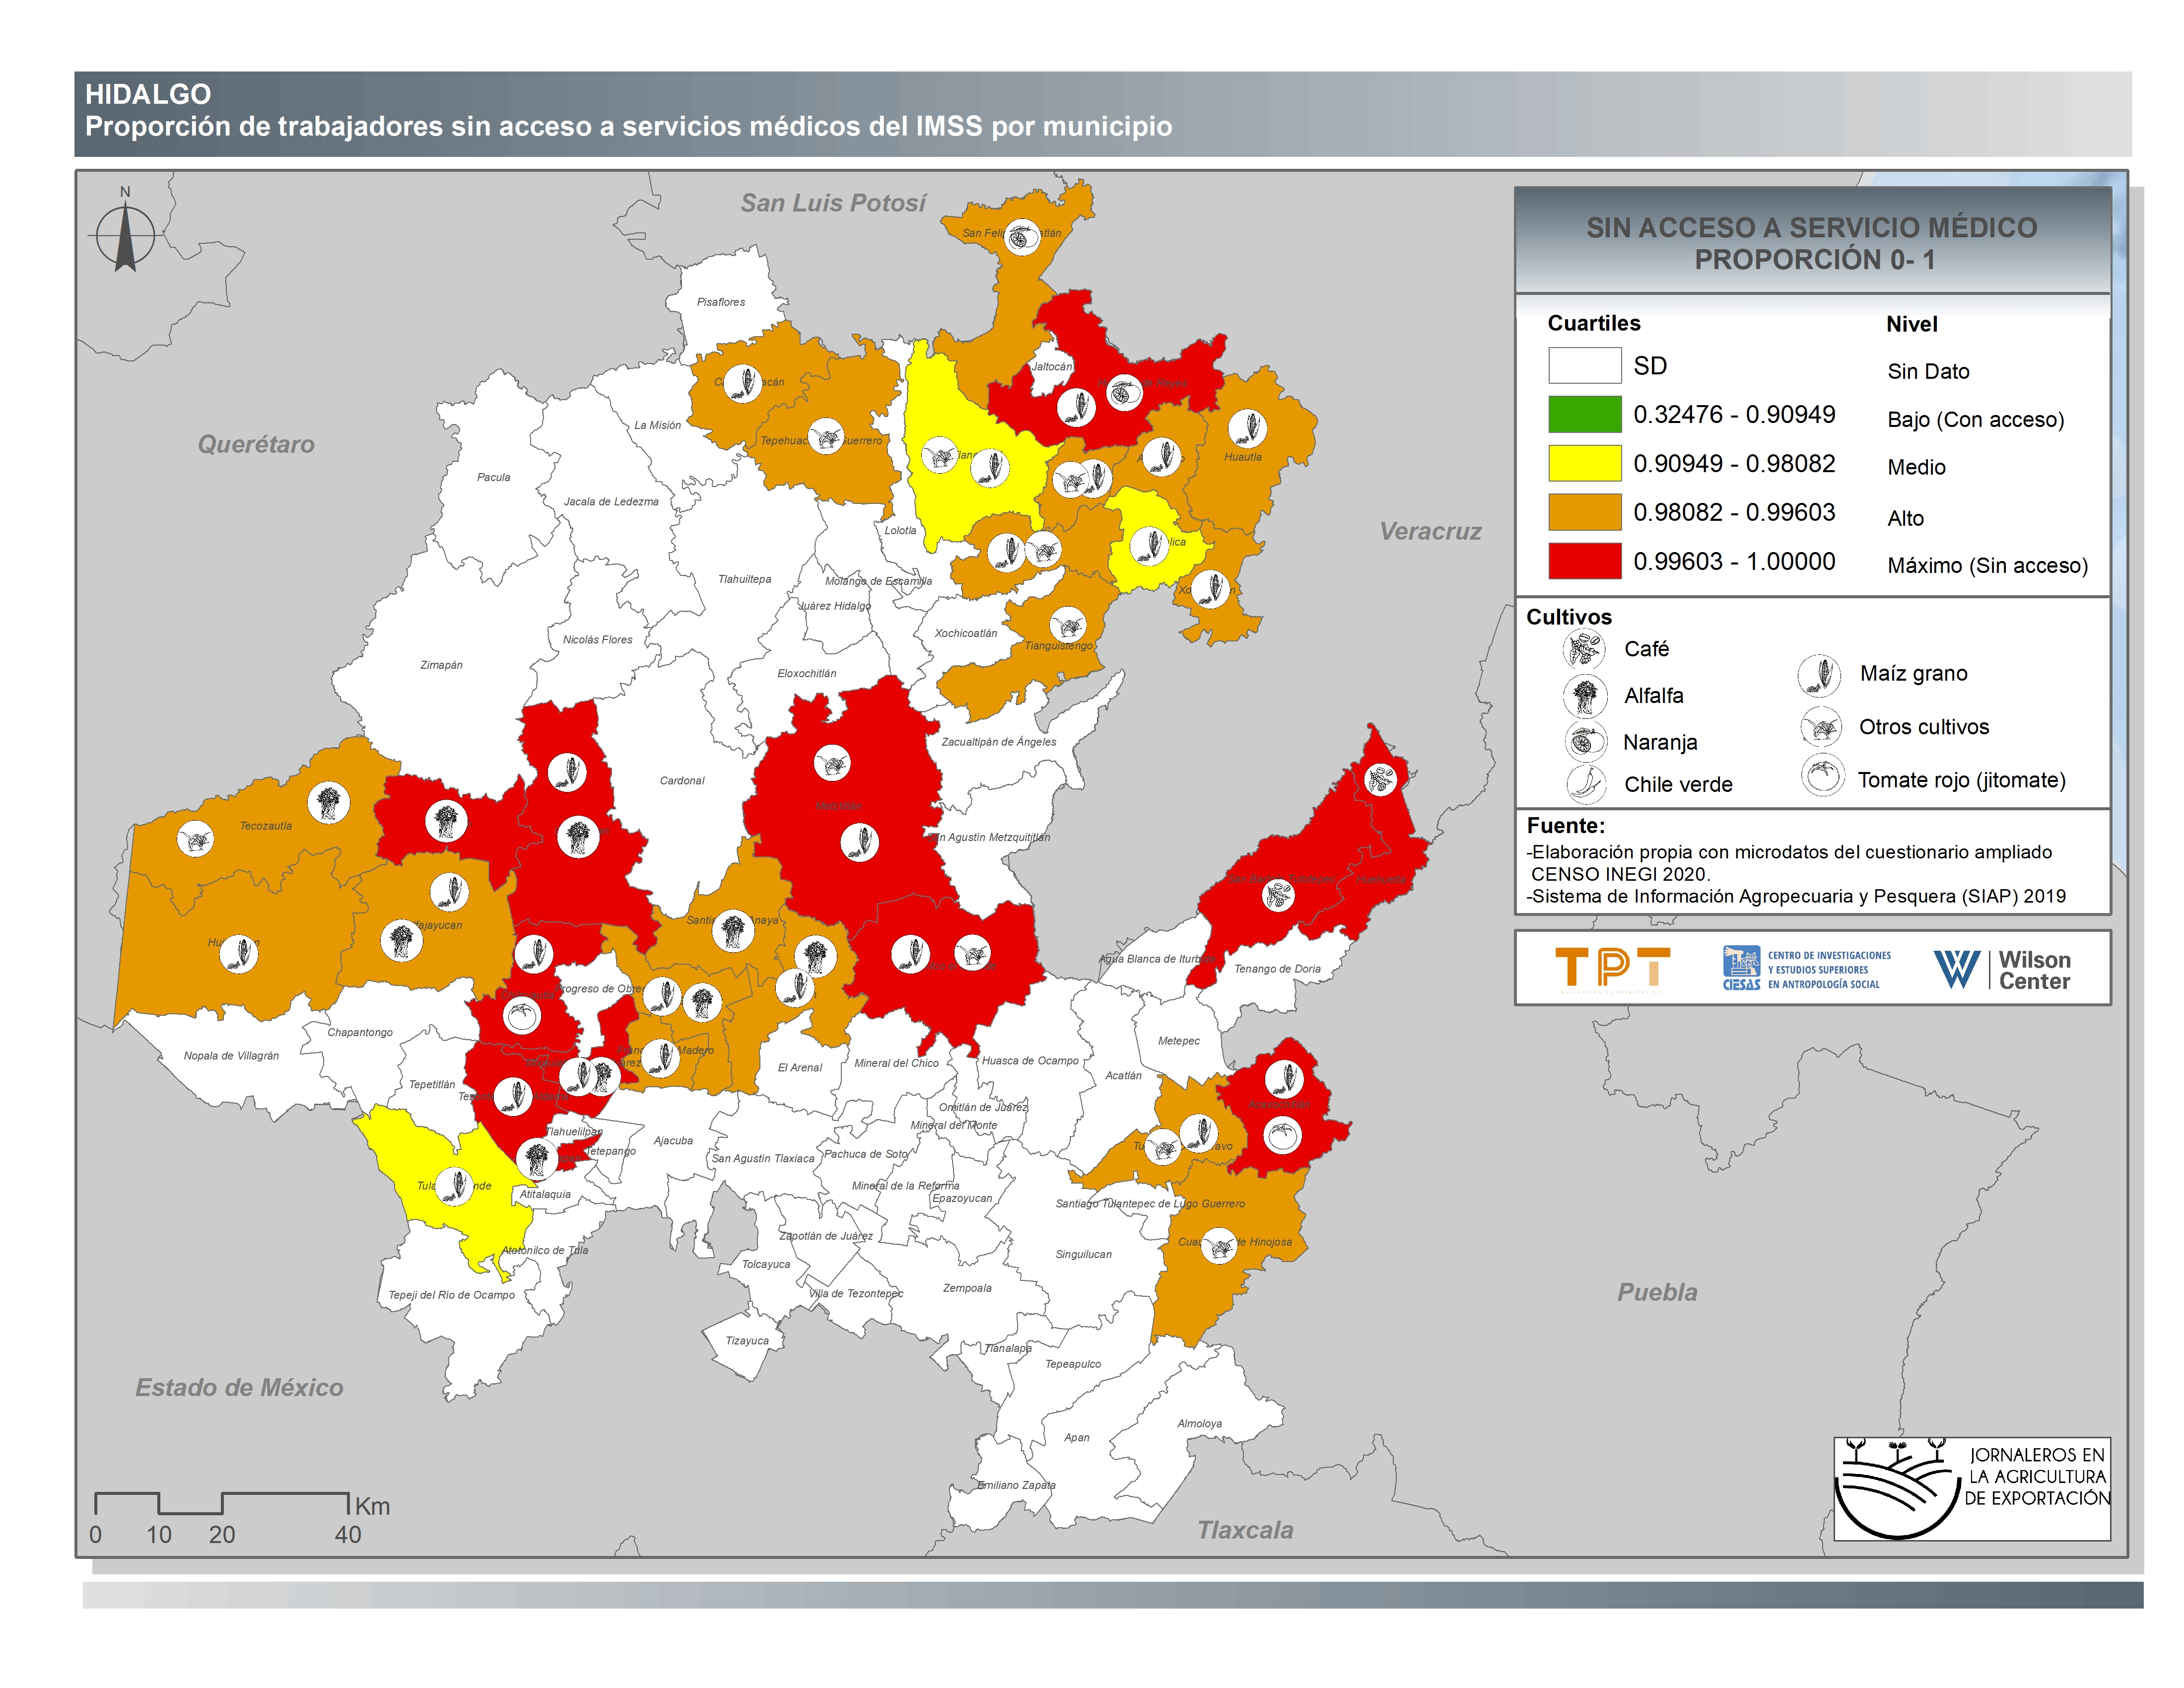
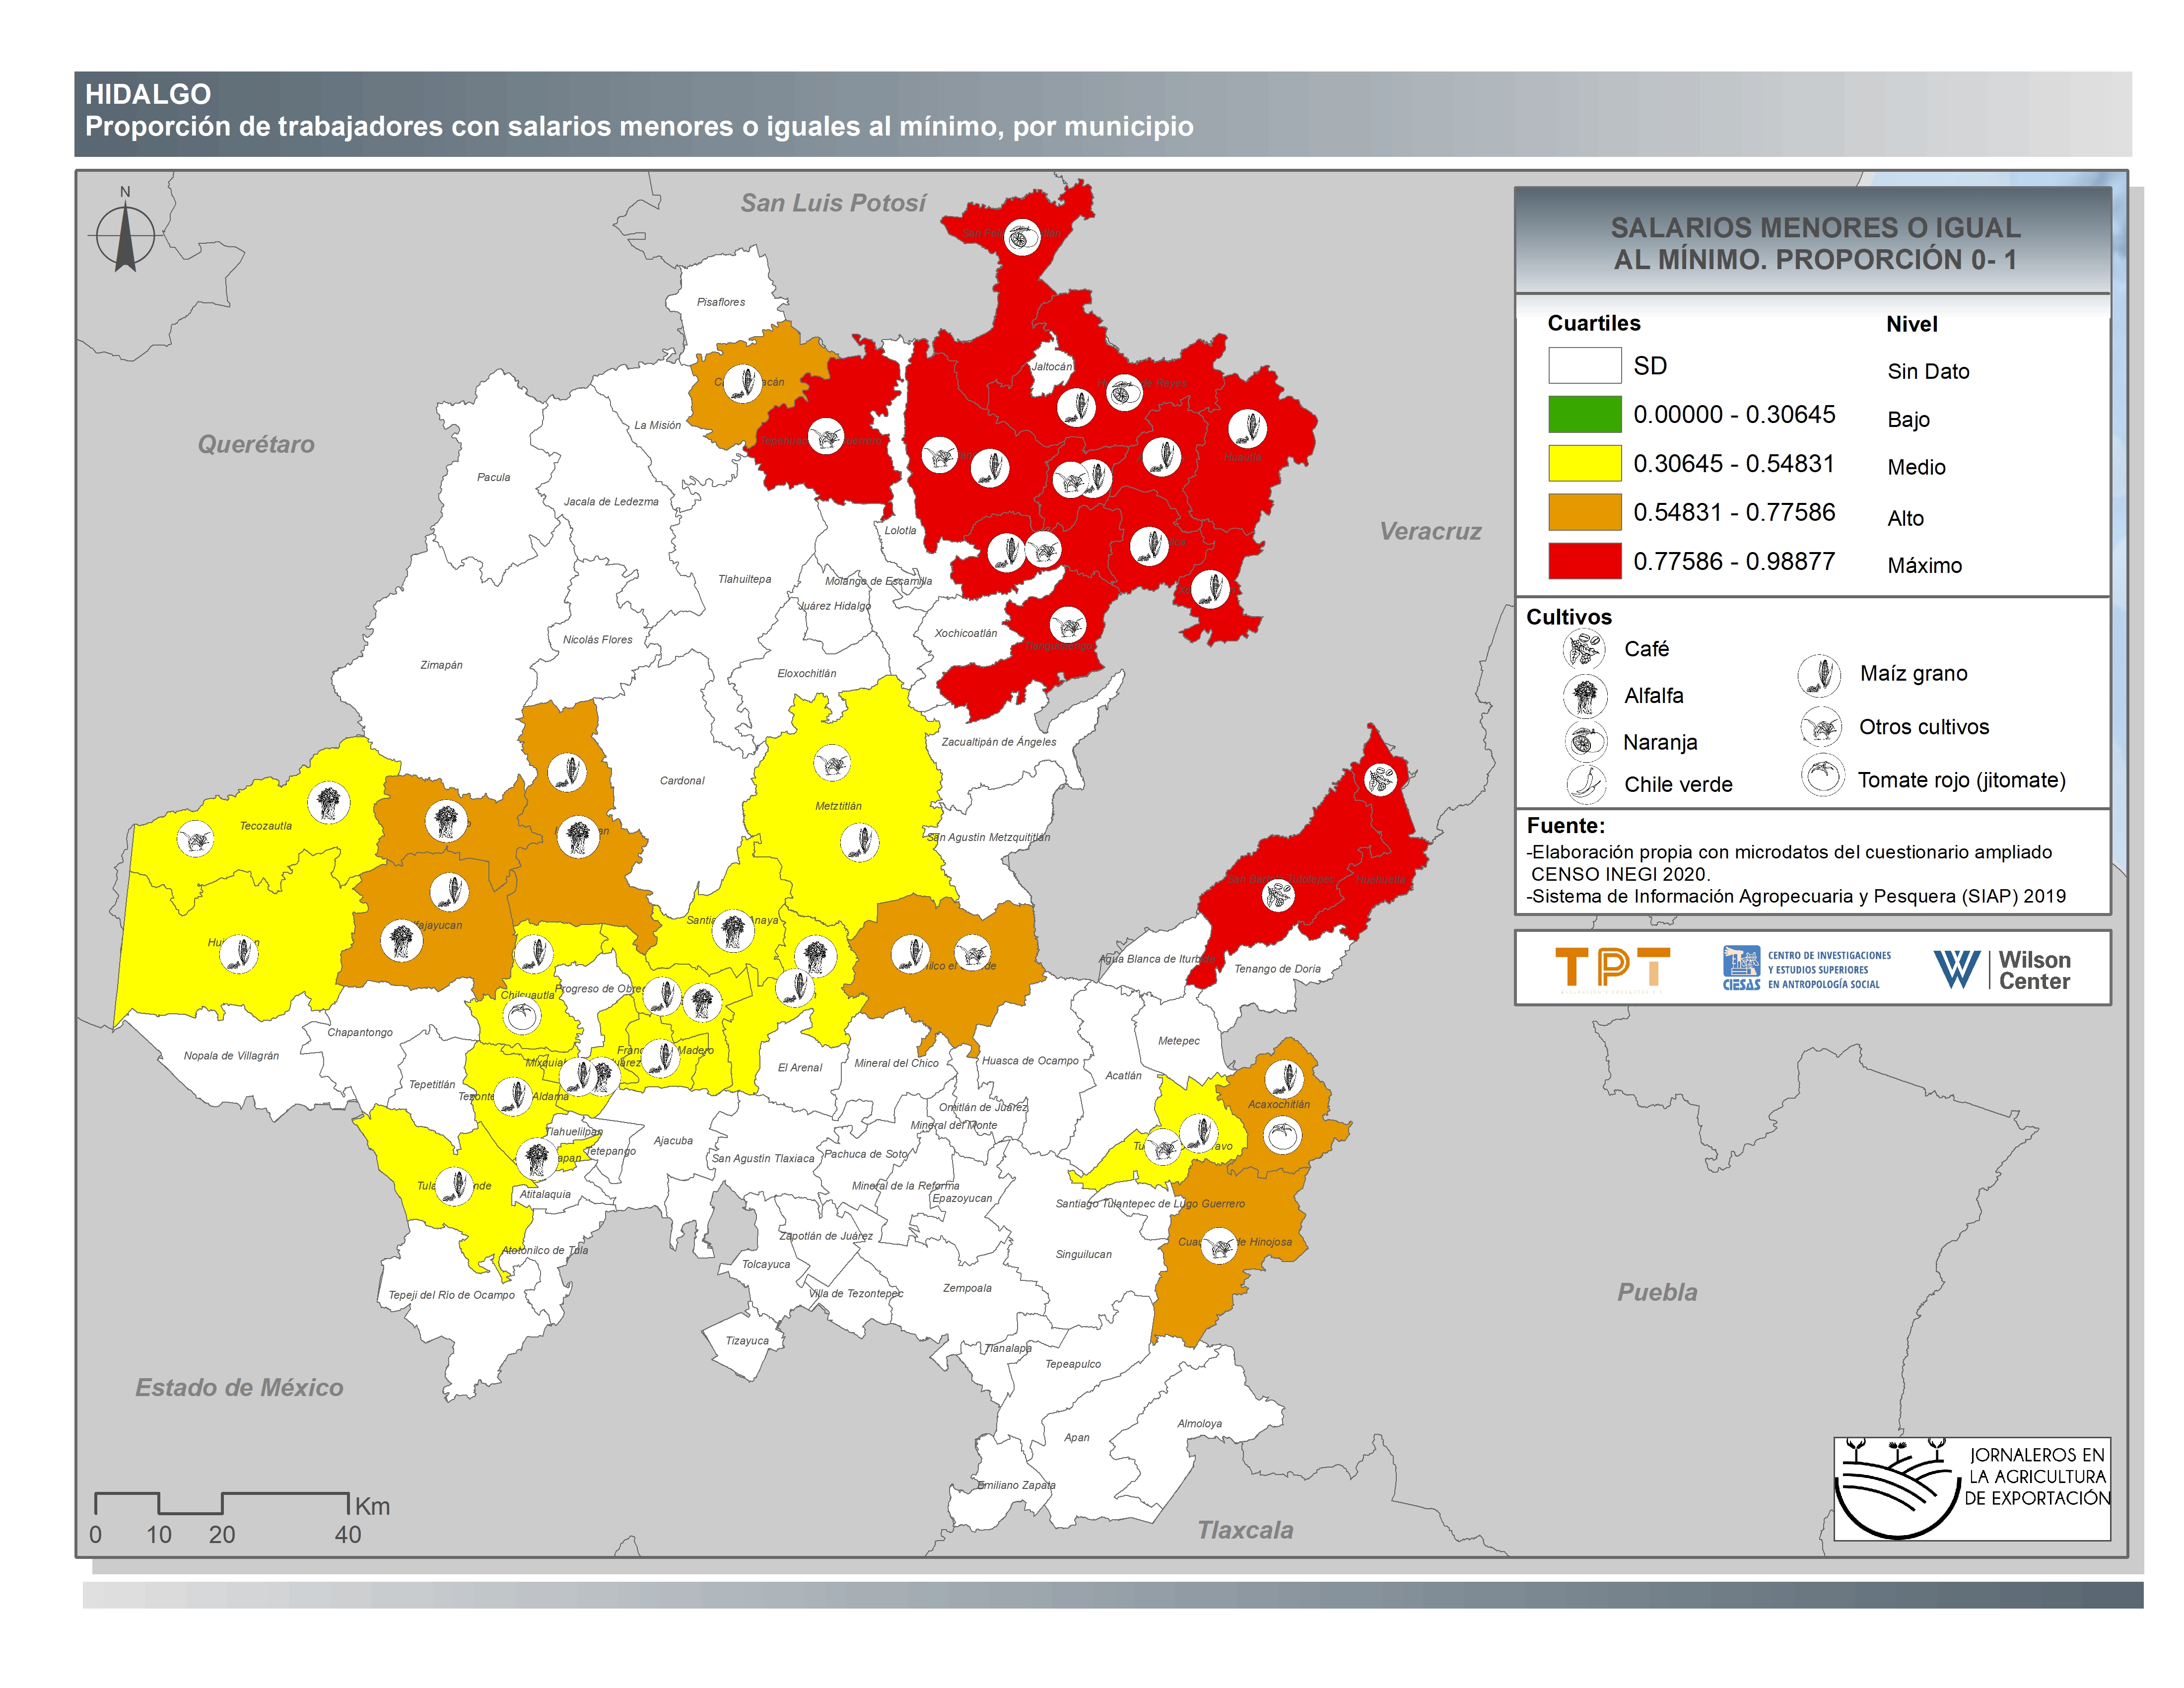
Hidalgo
-
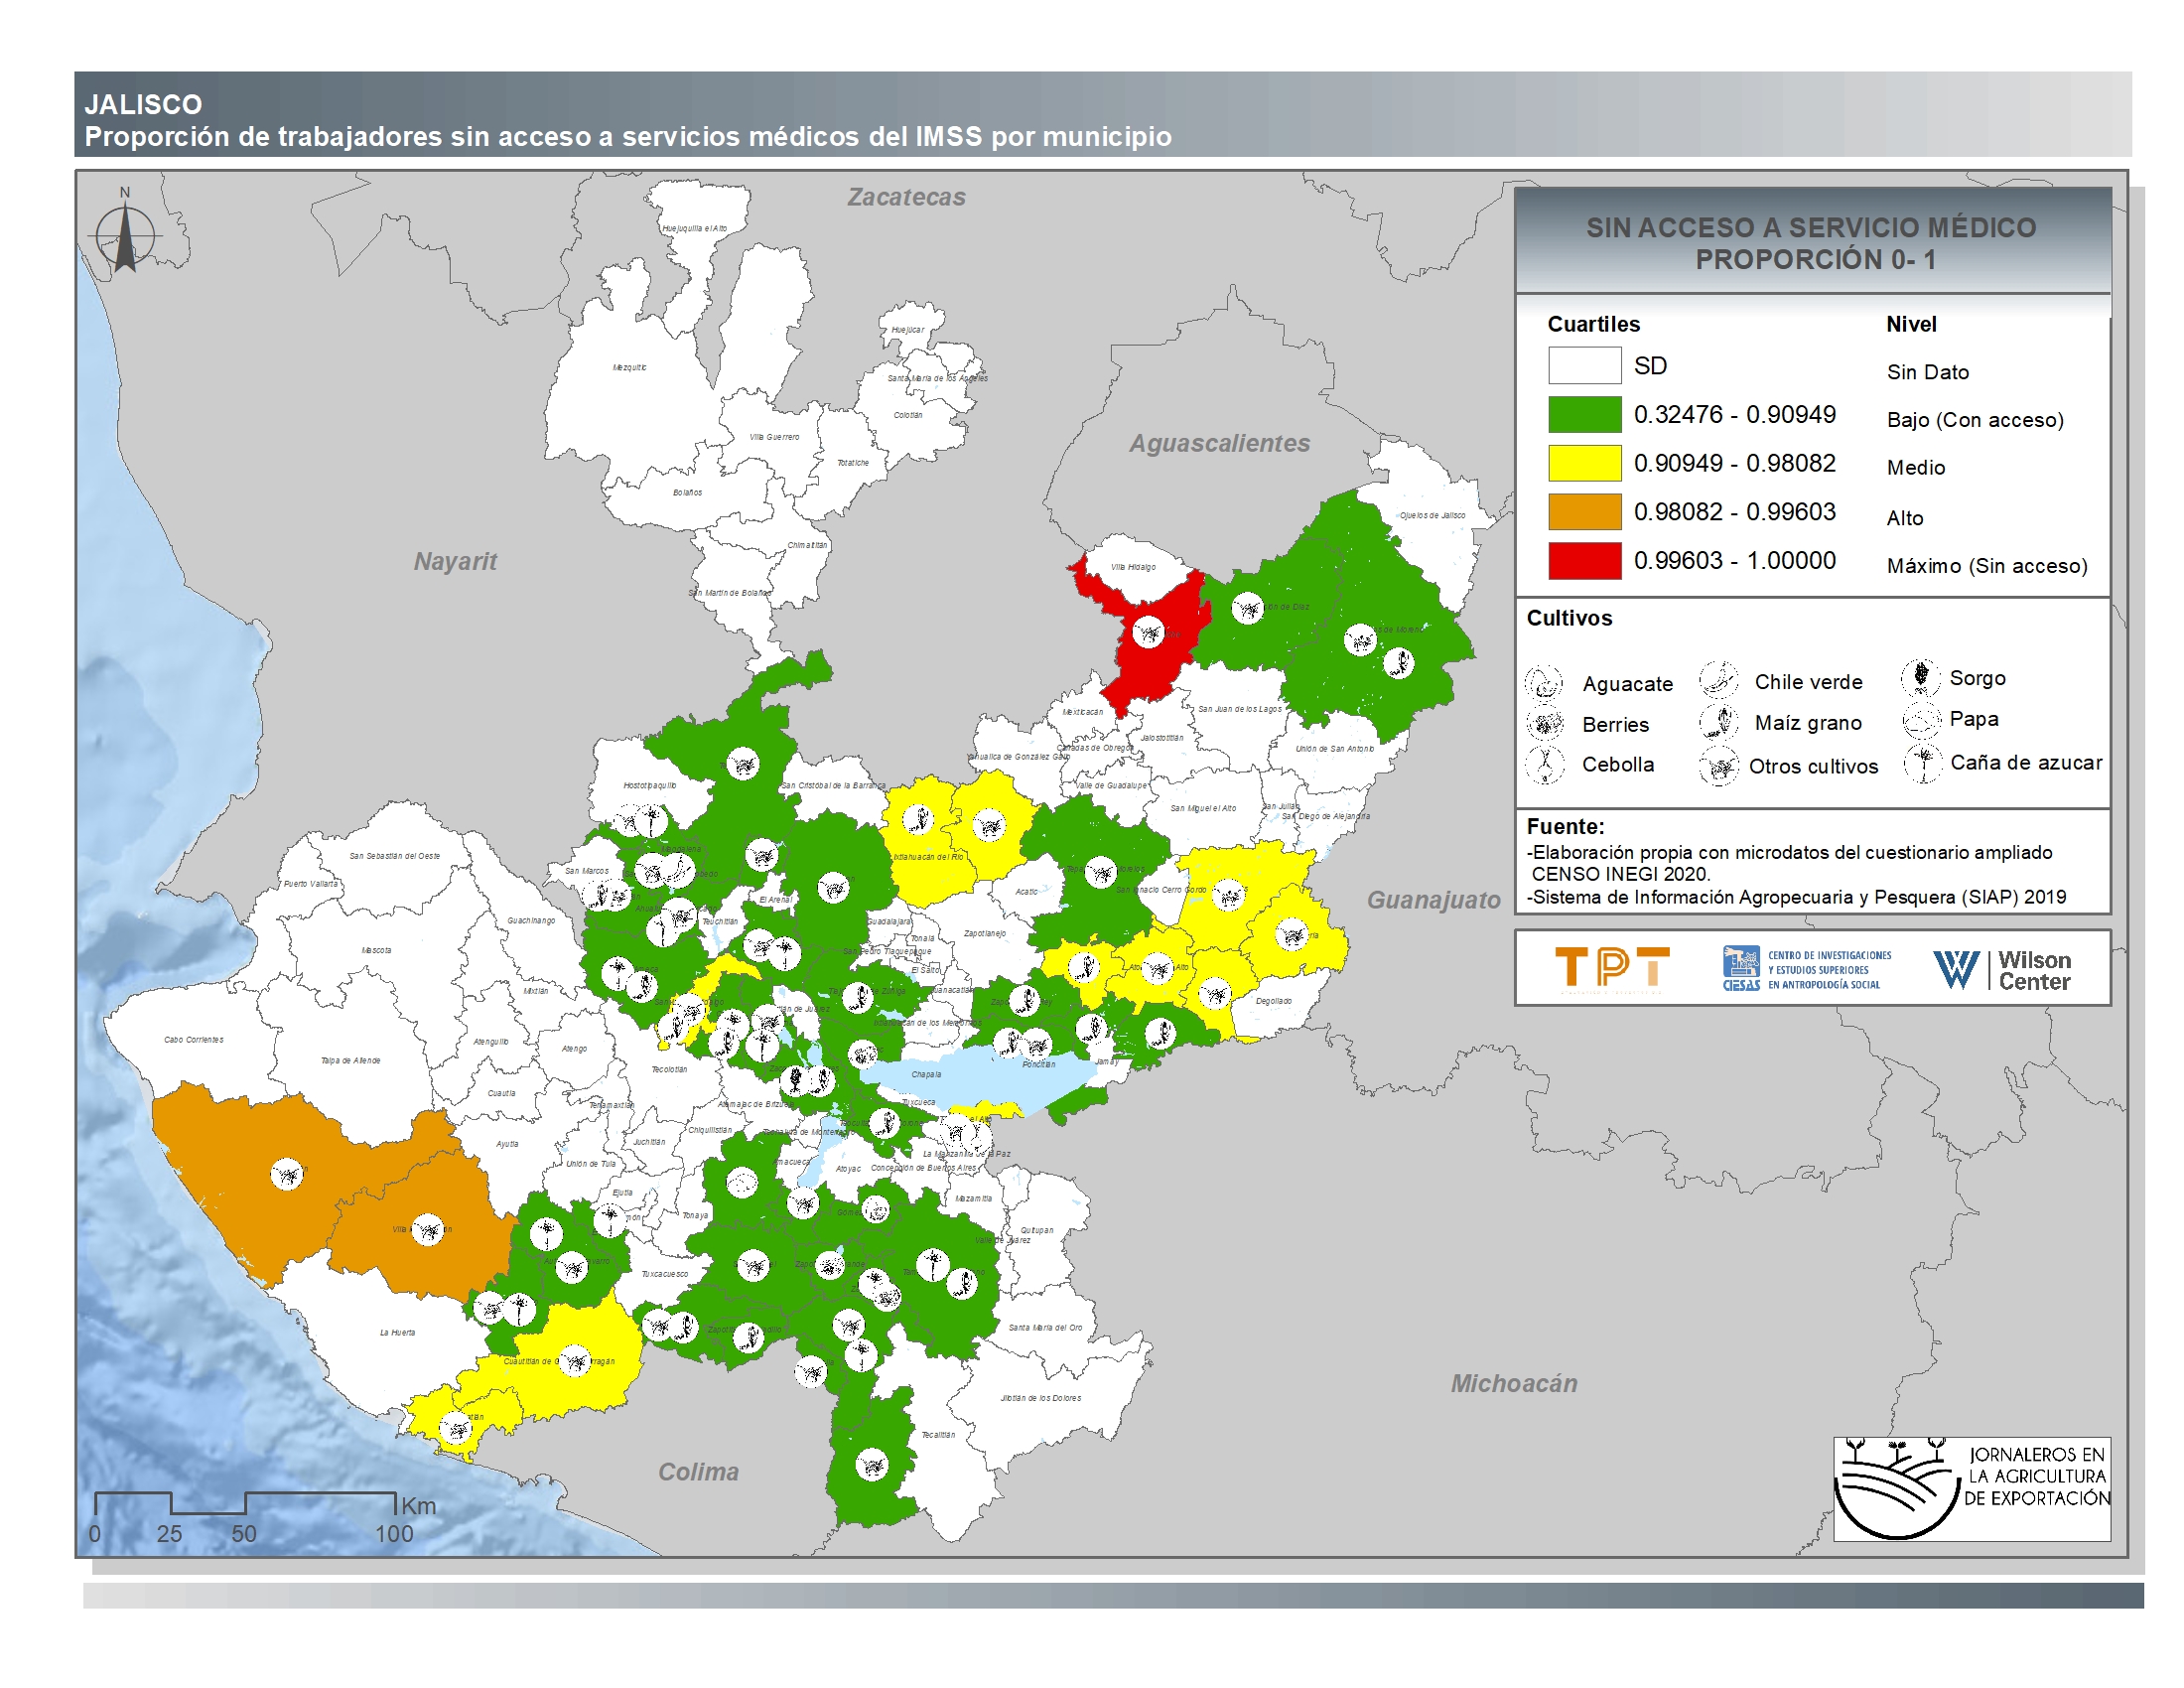
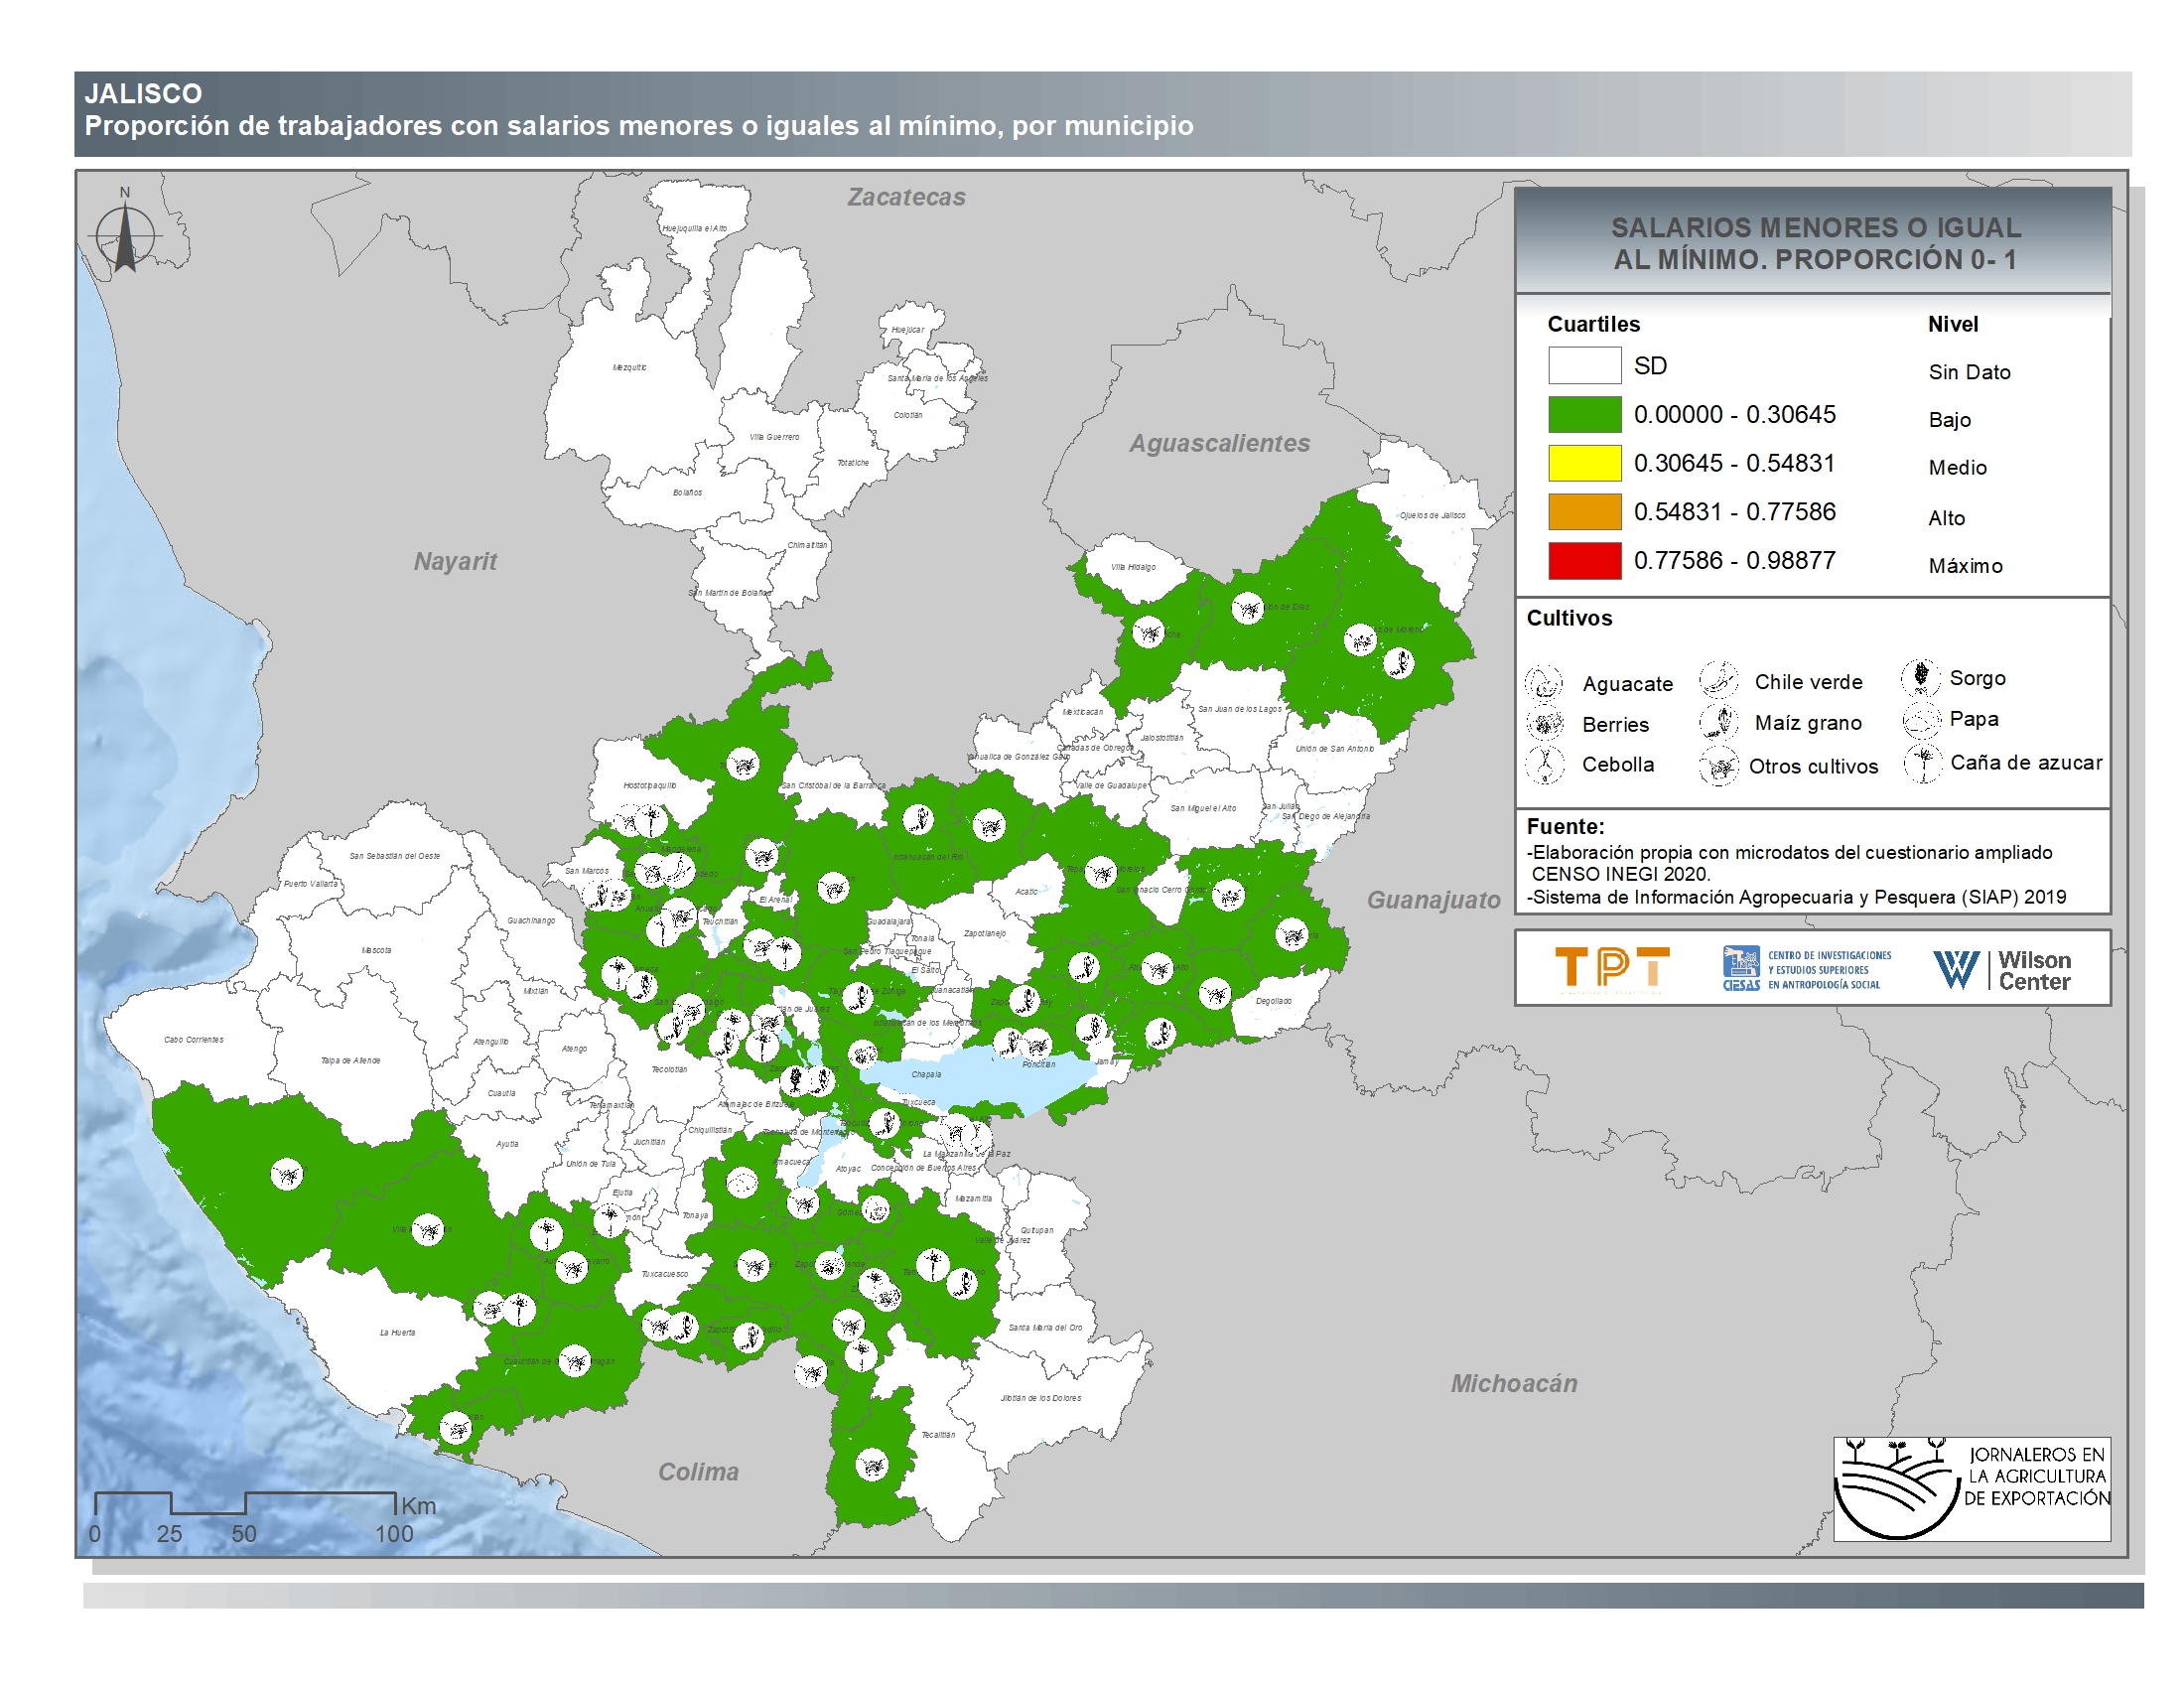
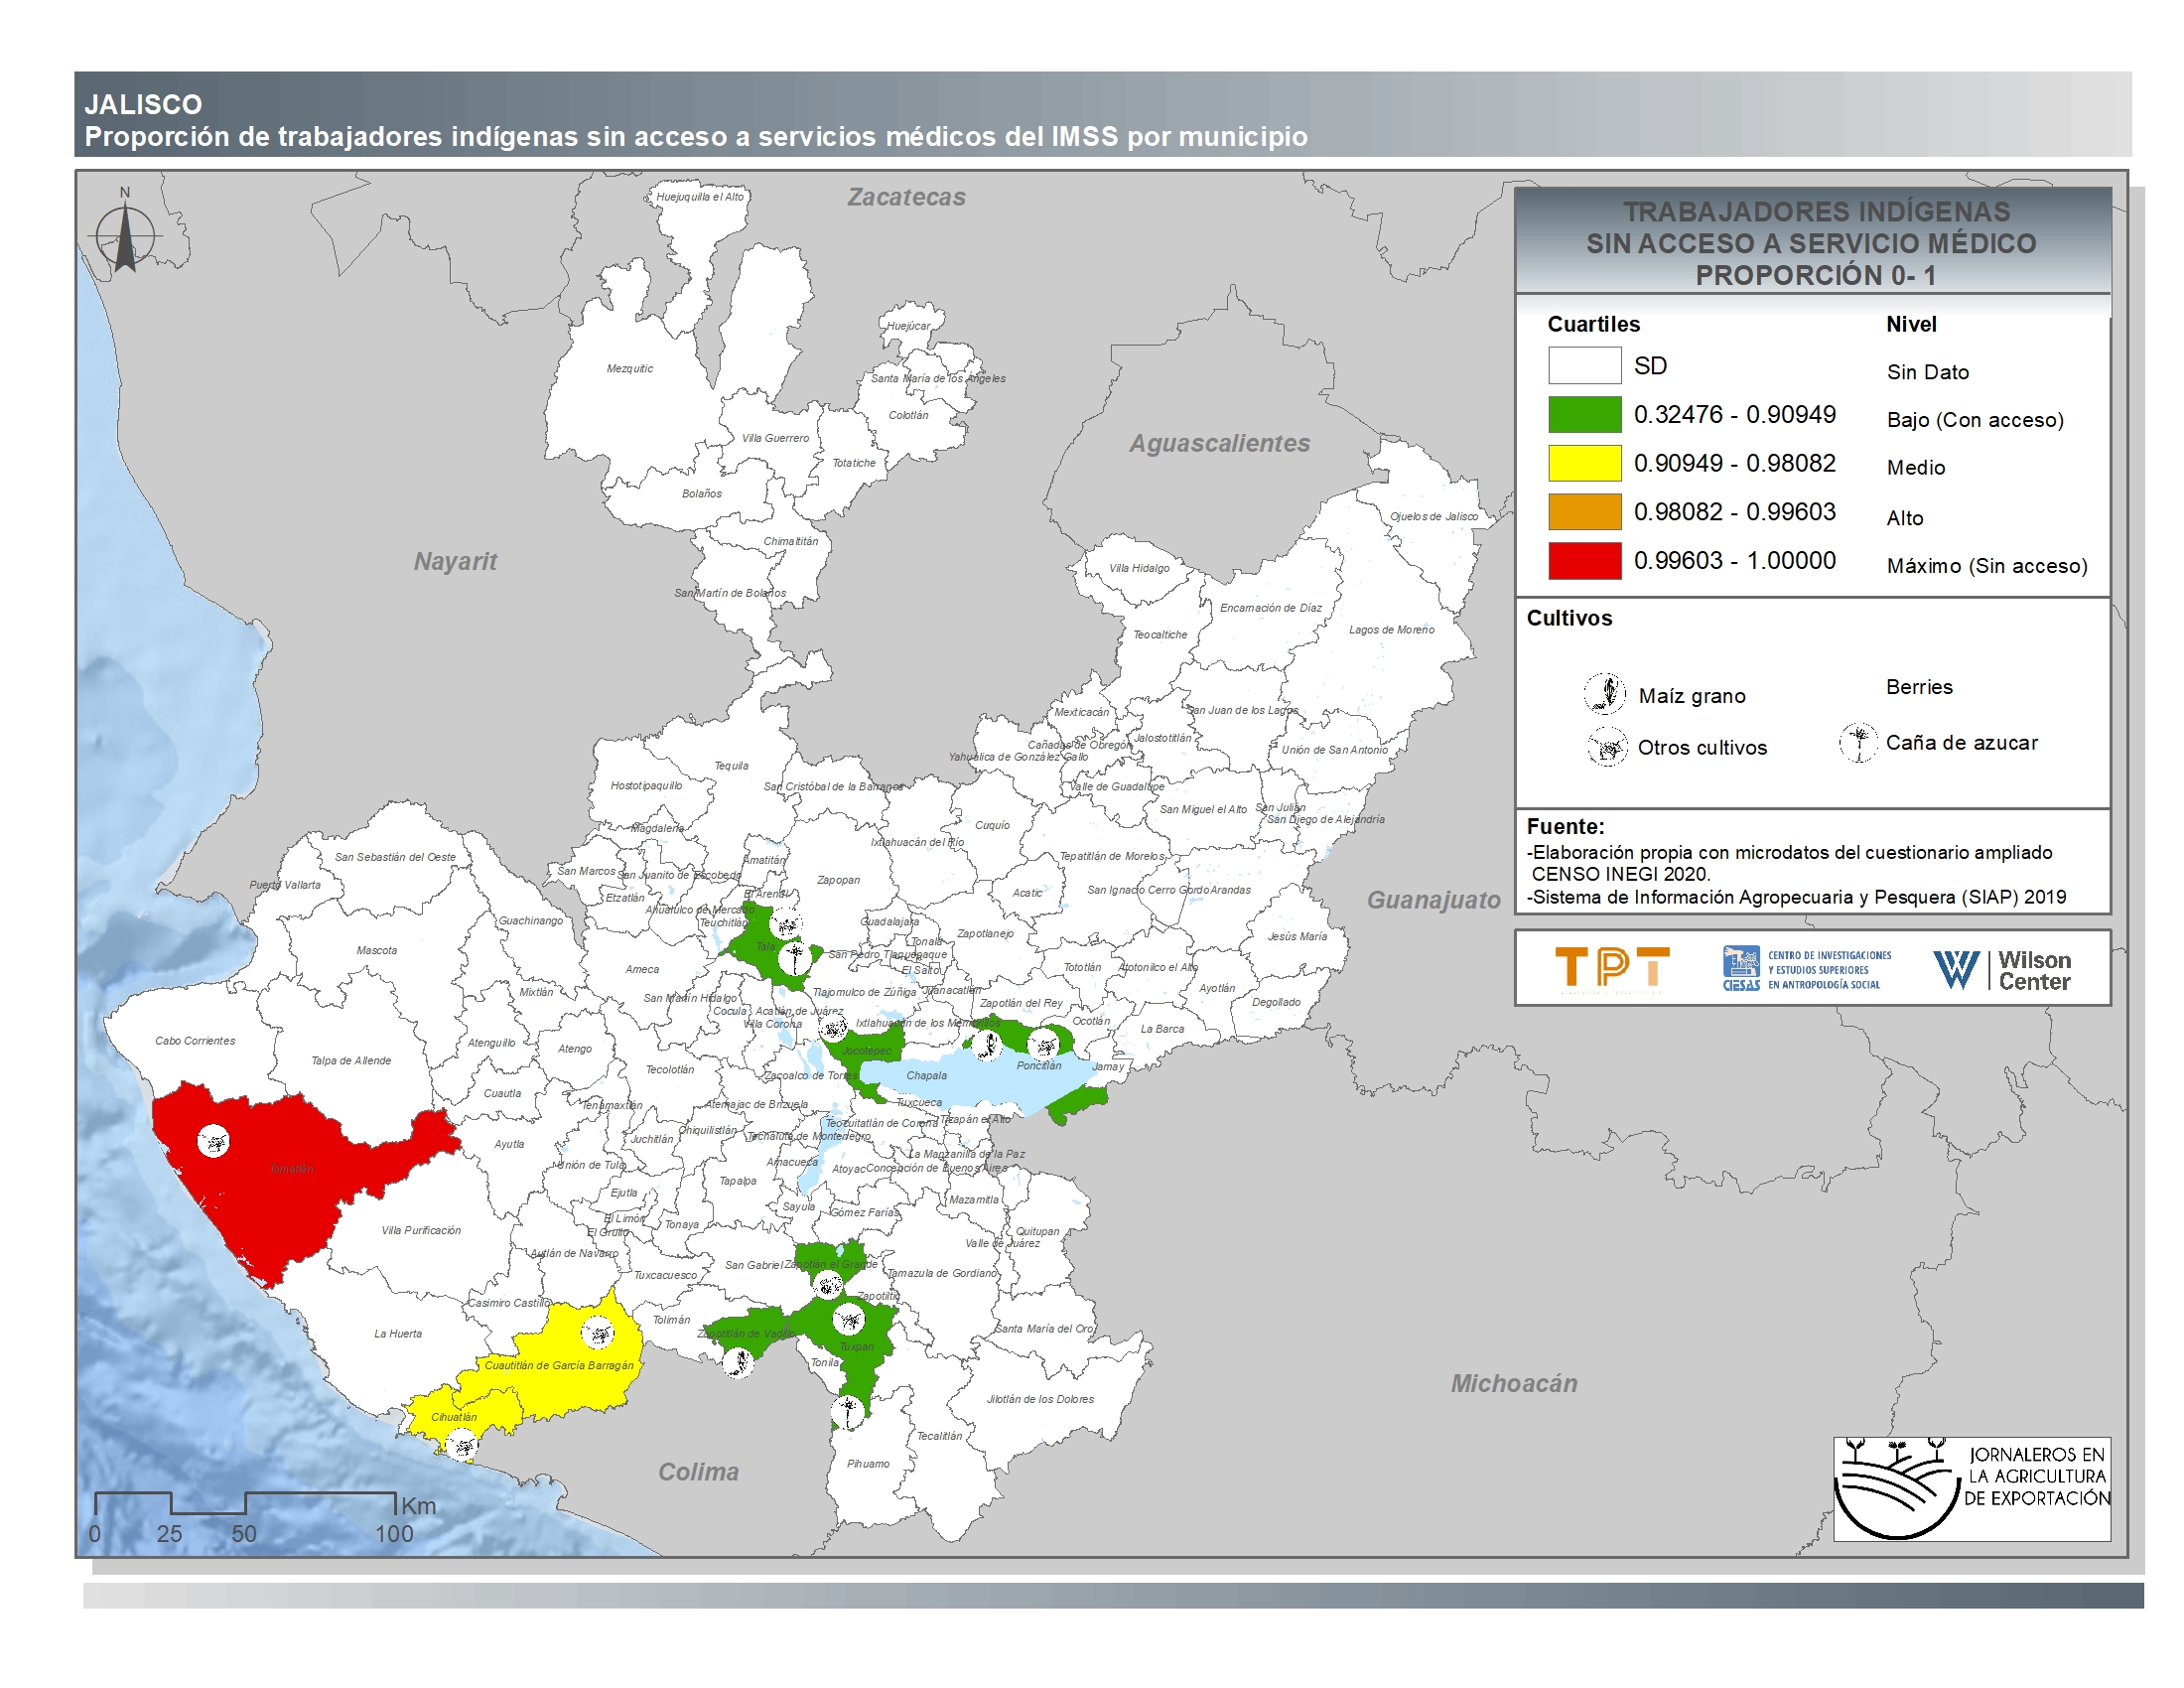
Jalisco
-
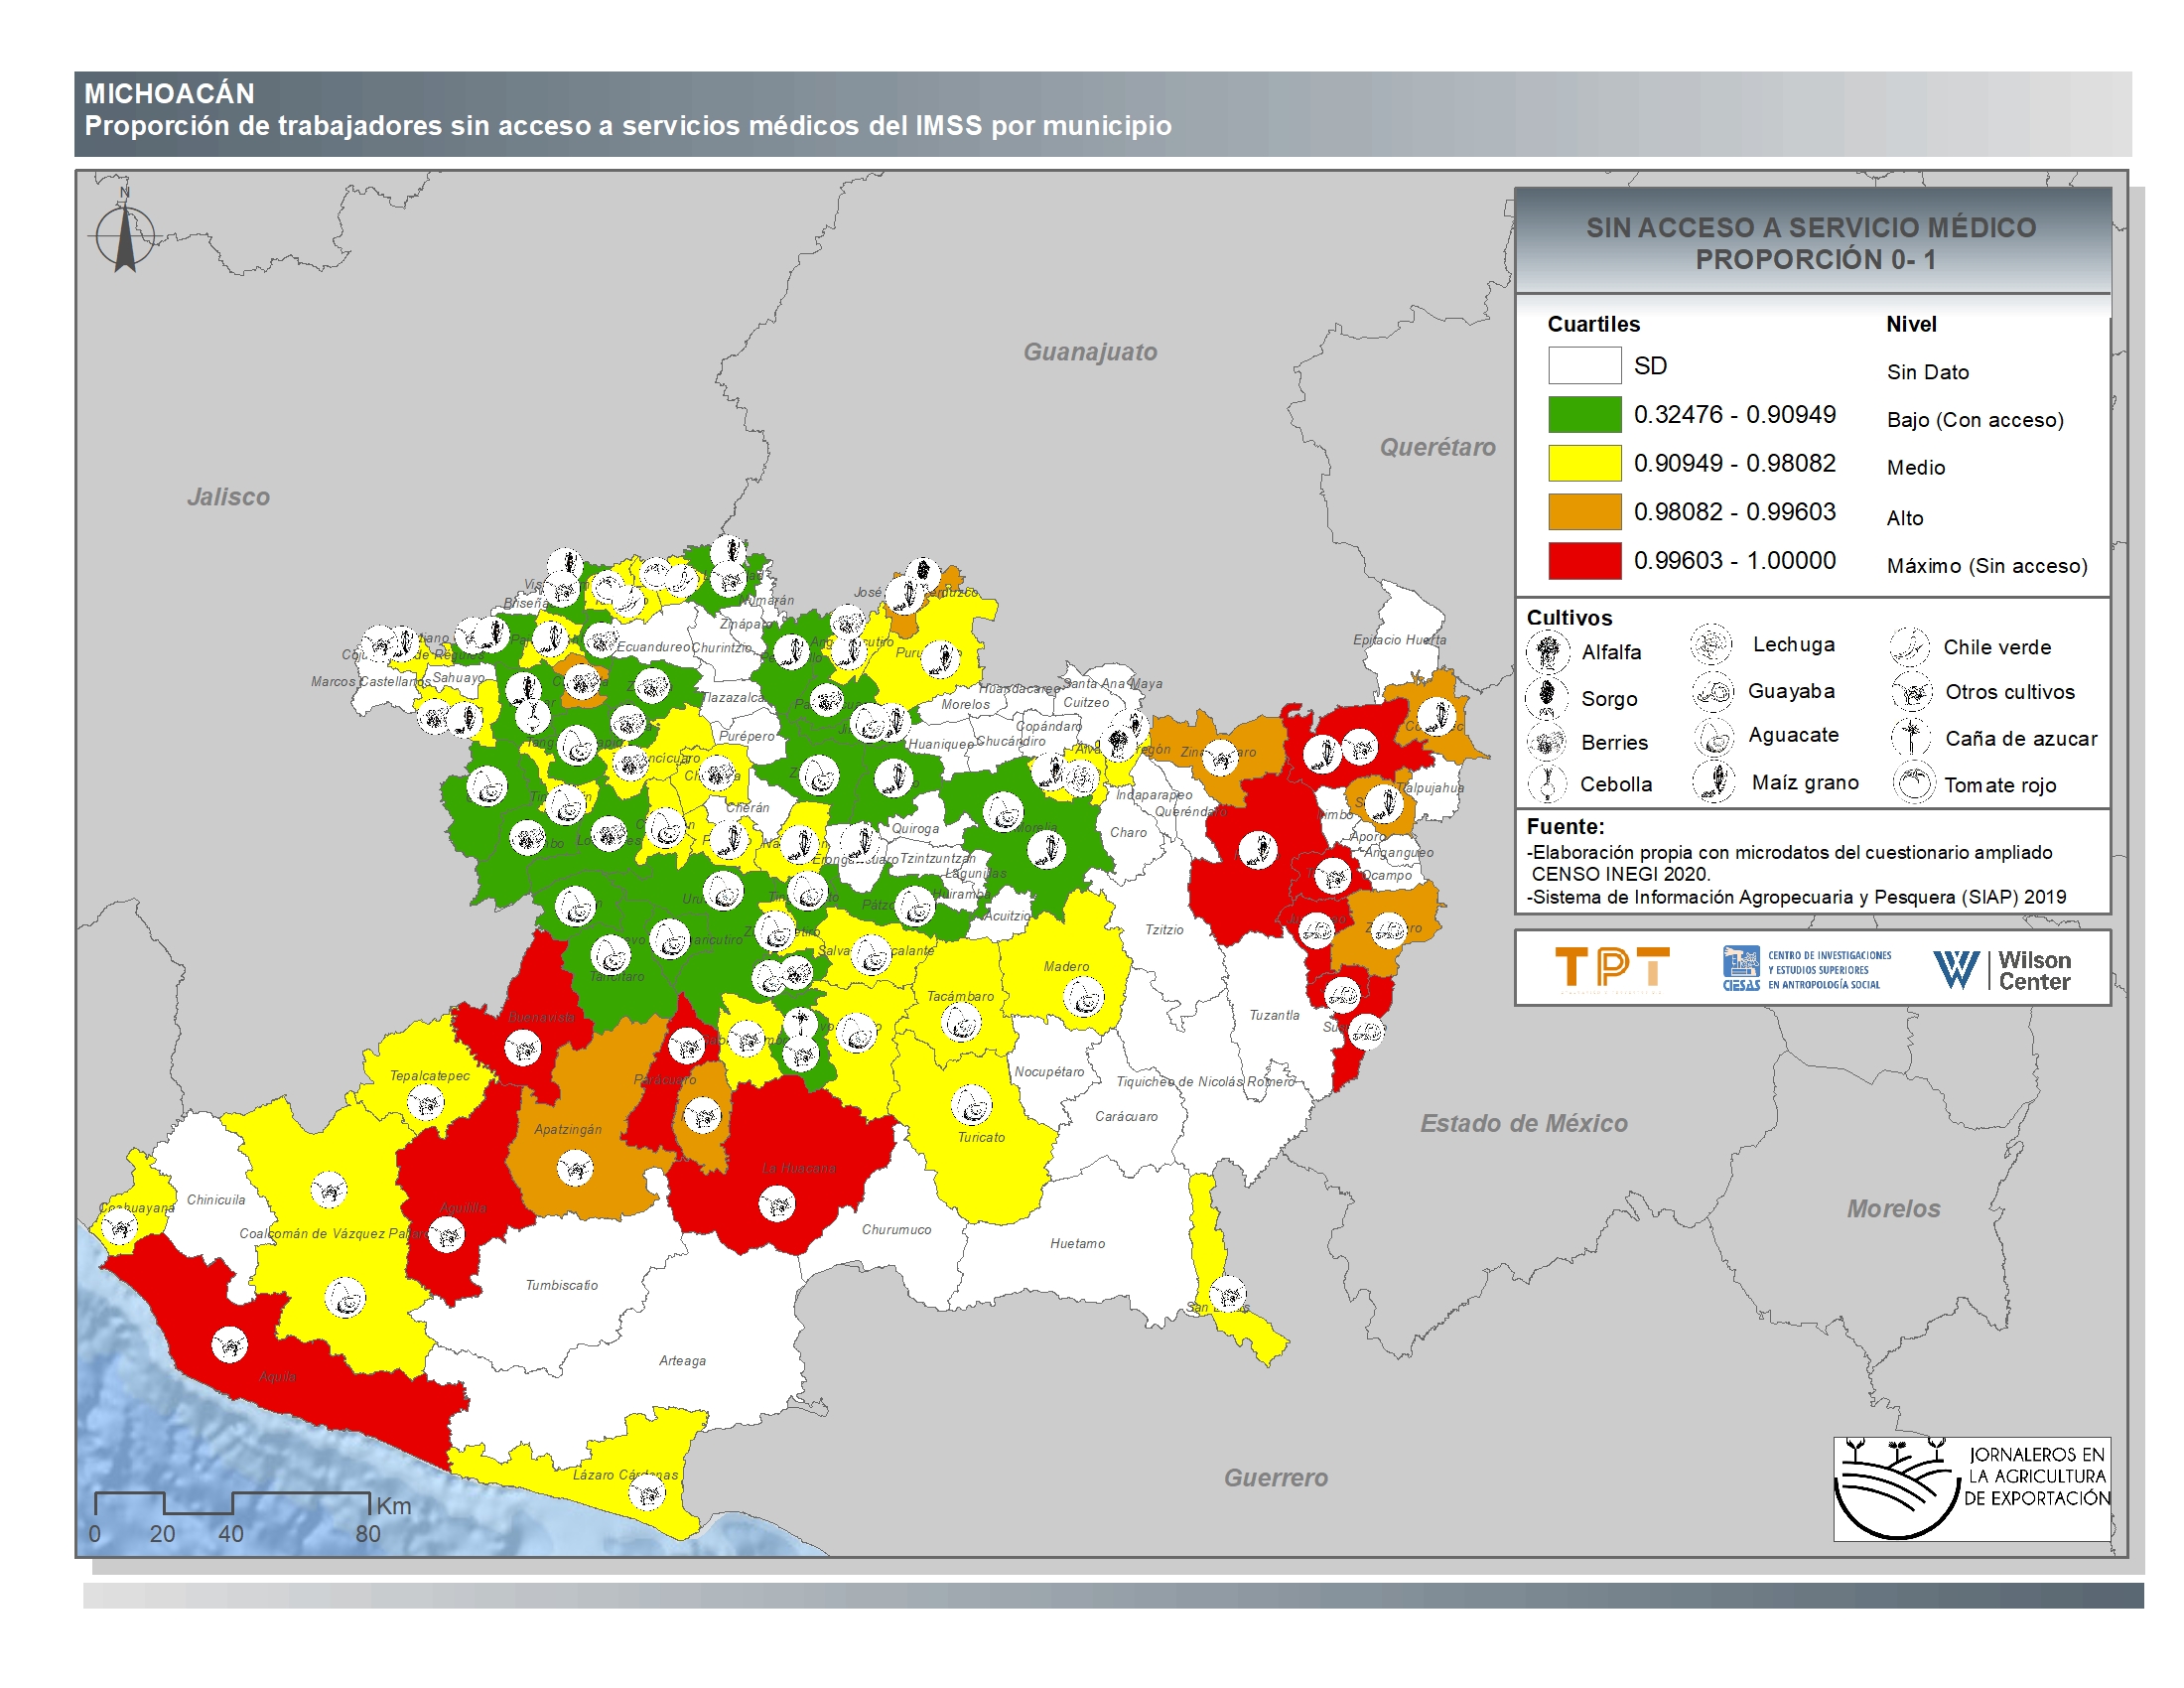
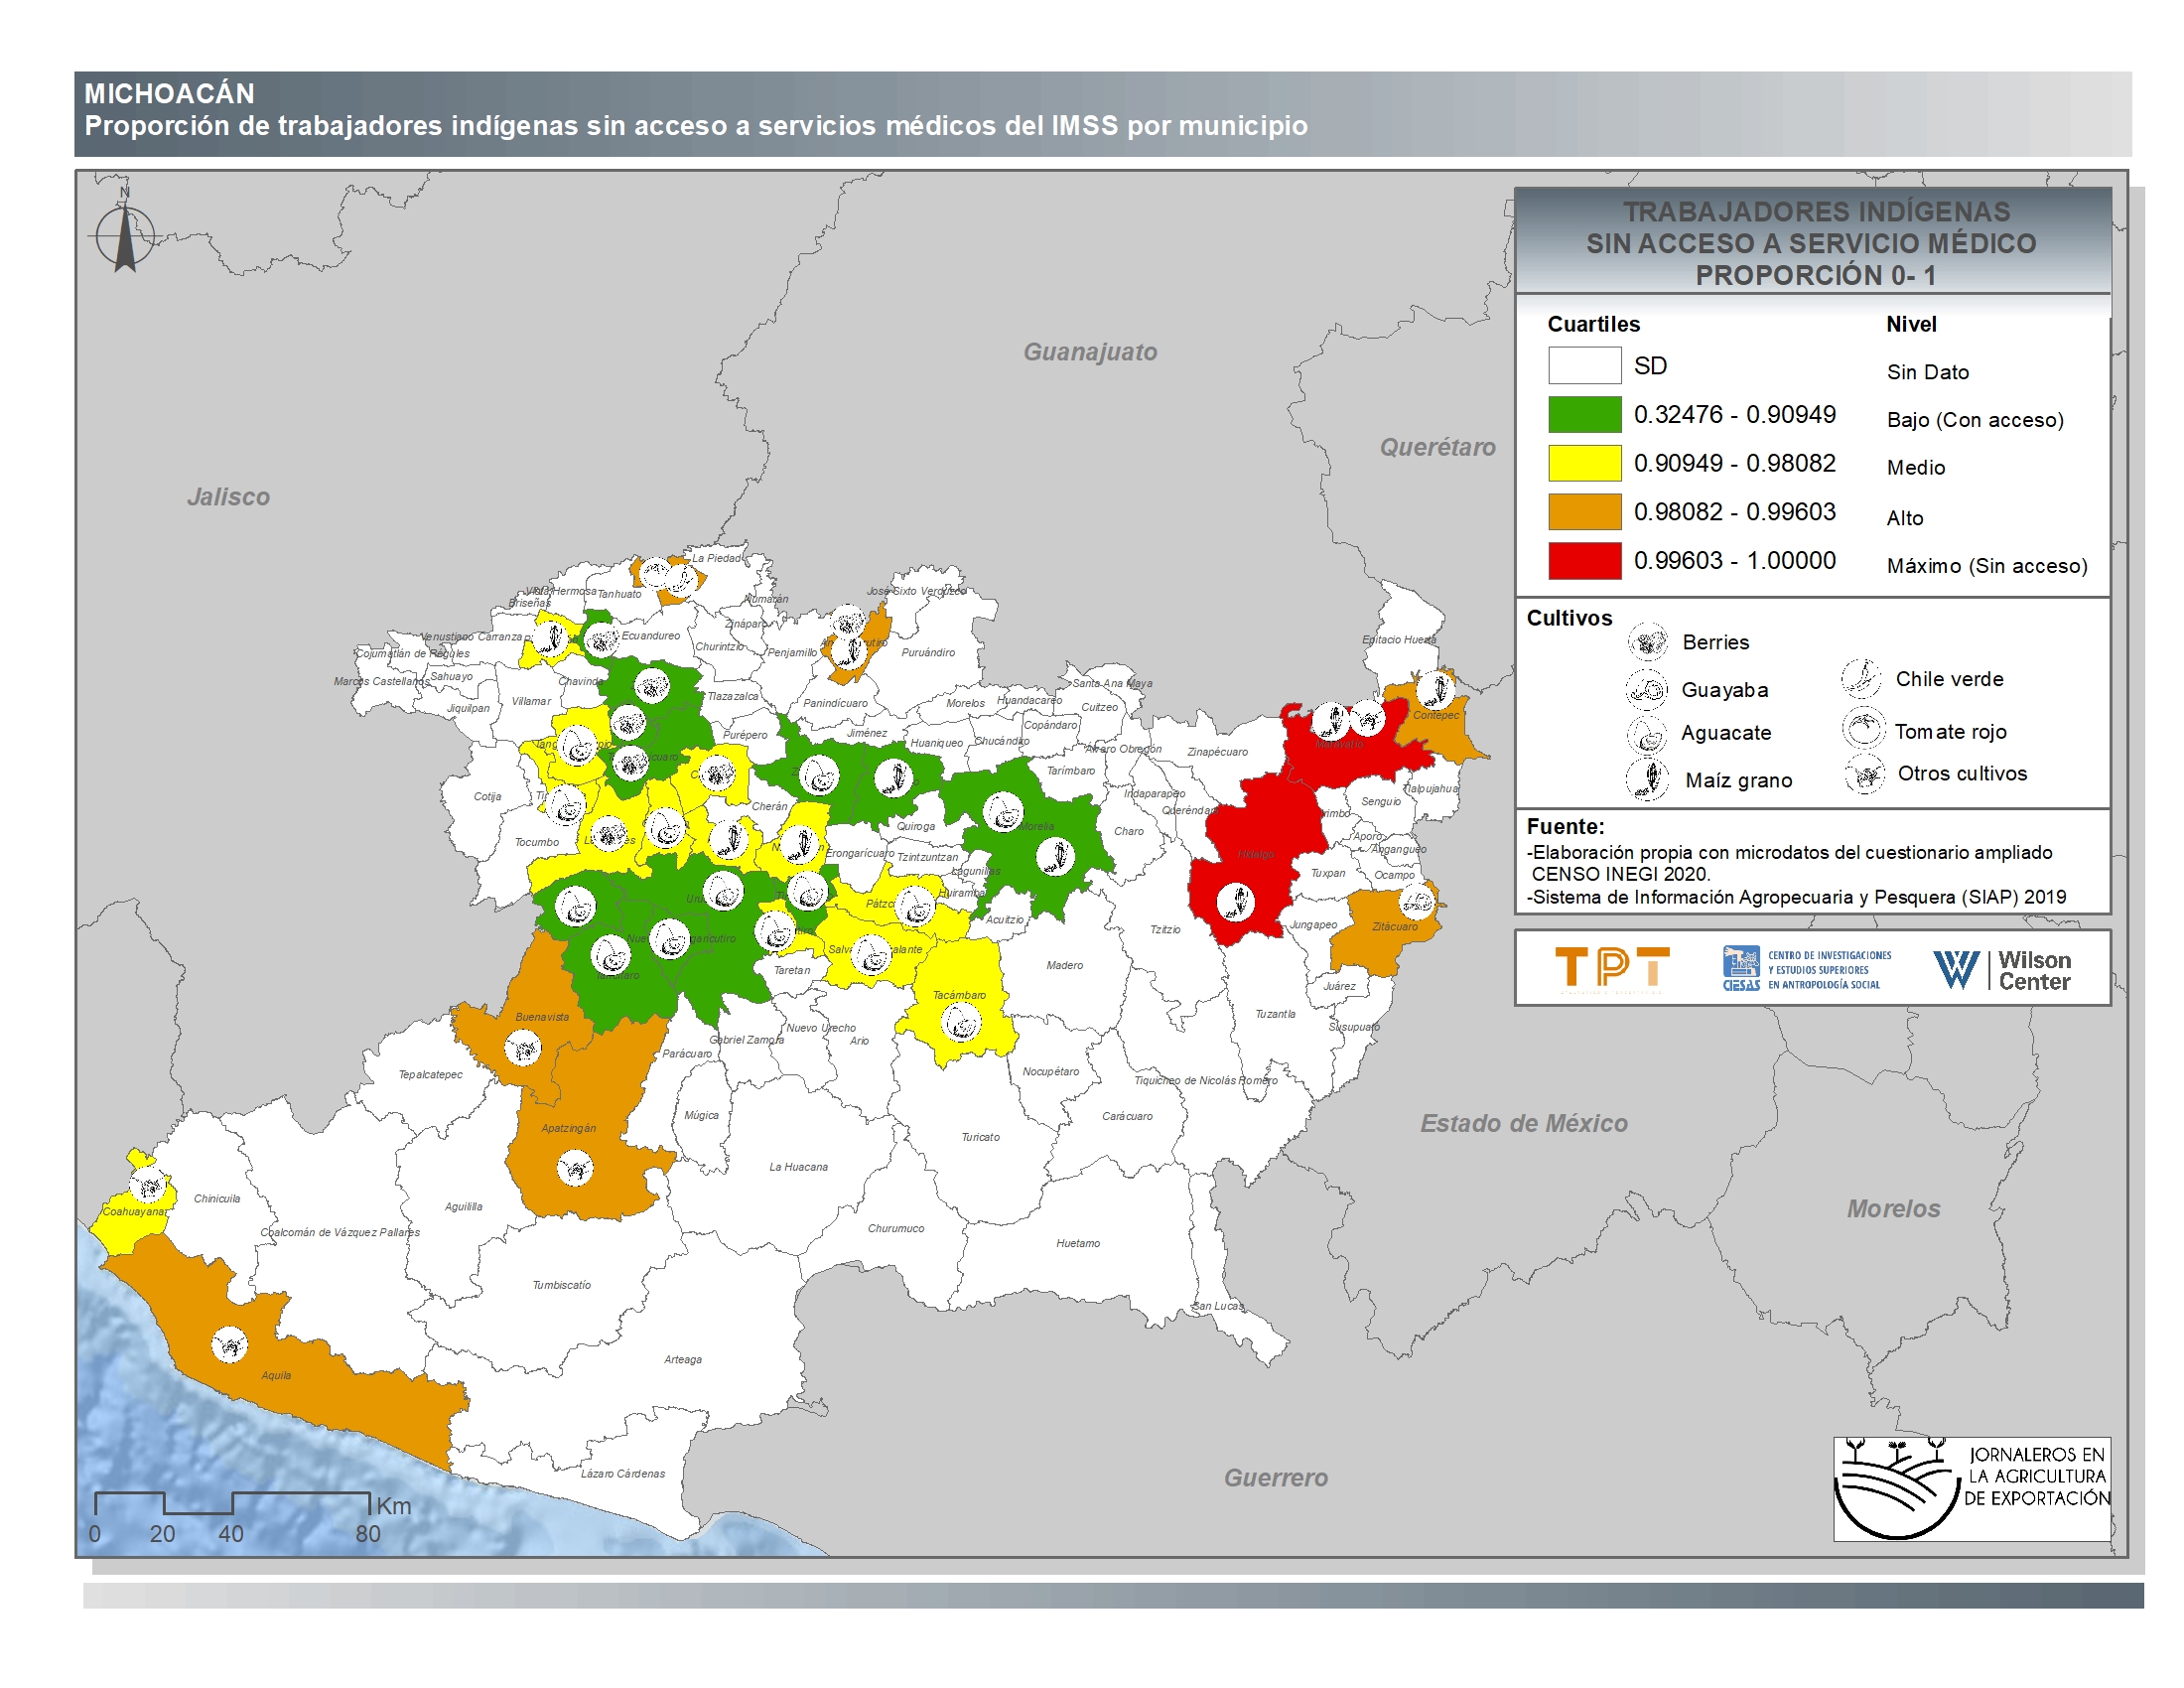
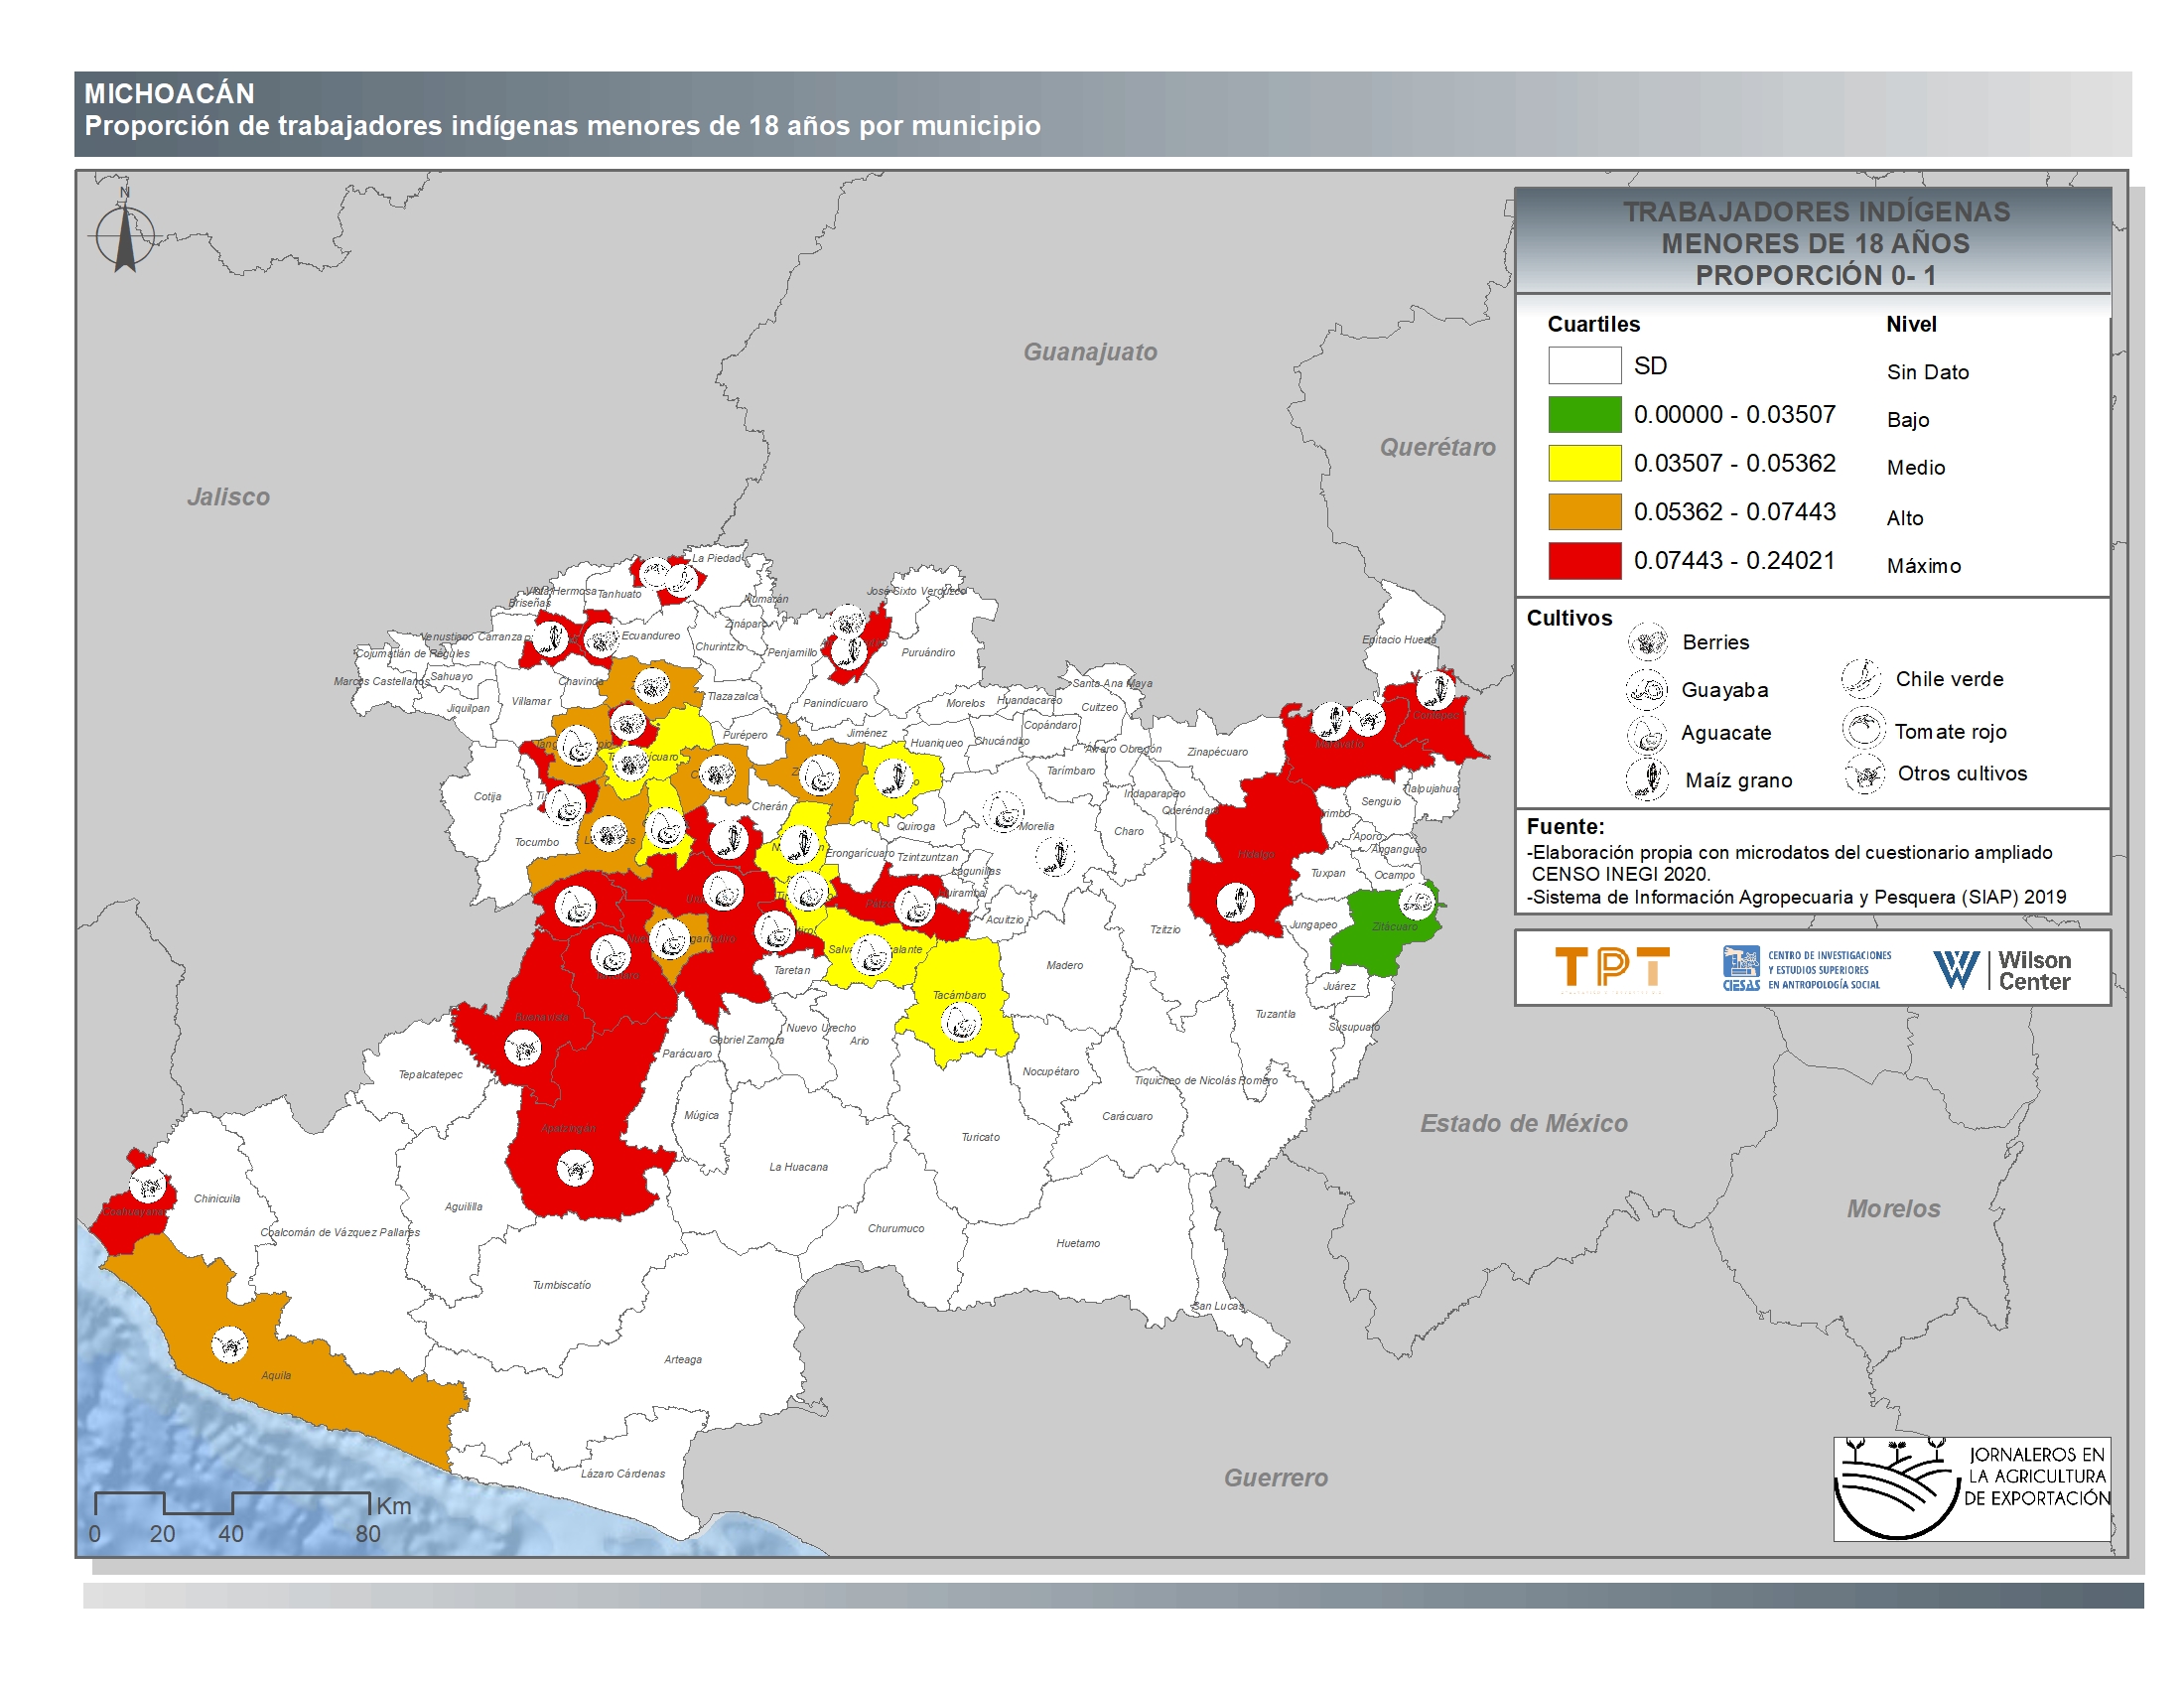
Michoacán
-
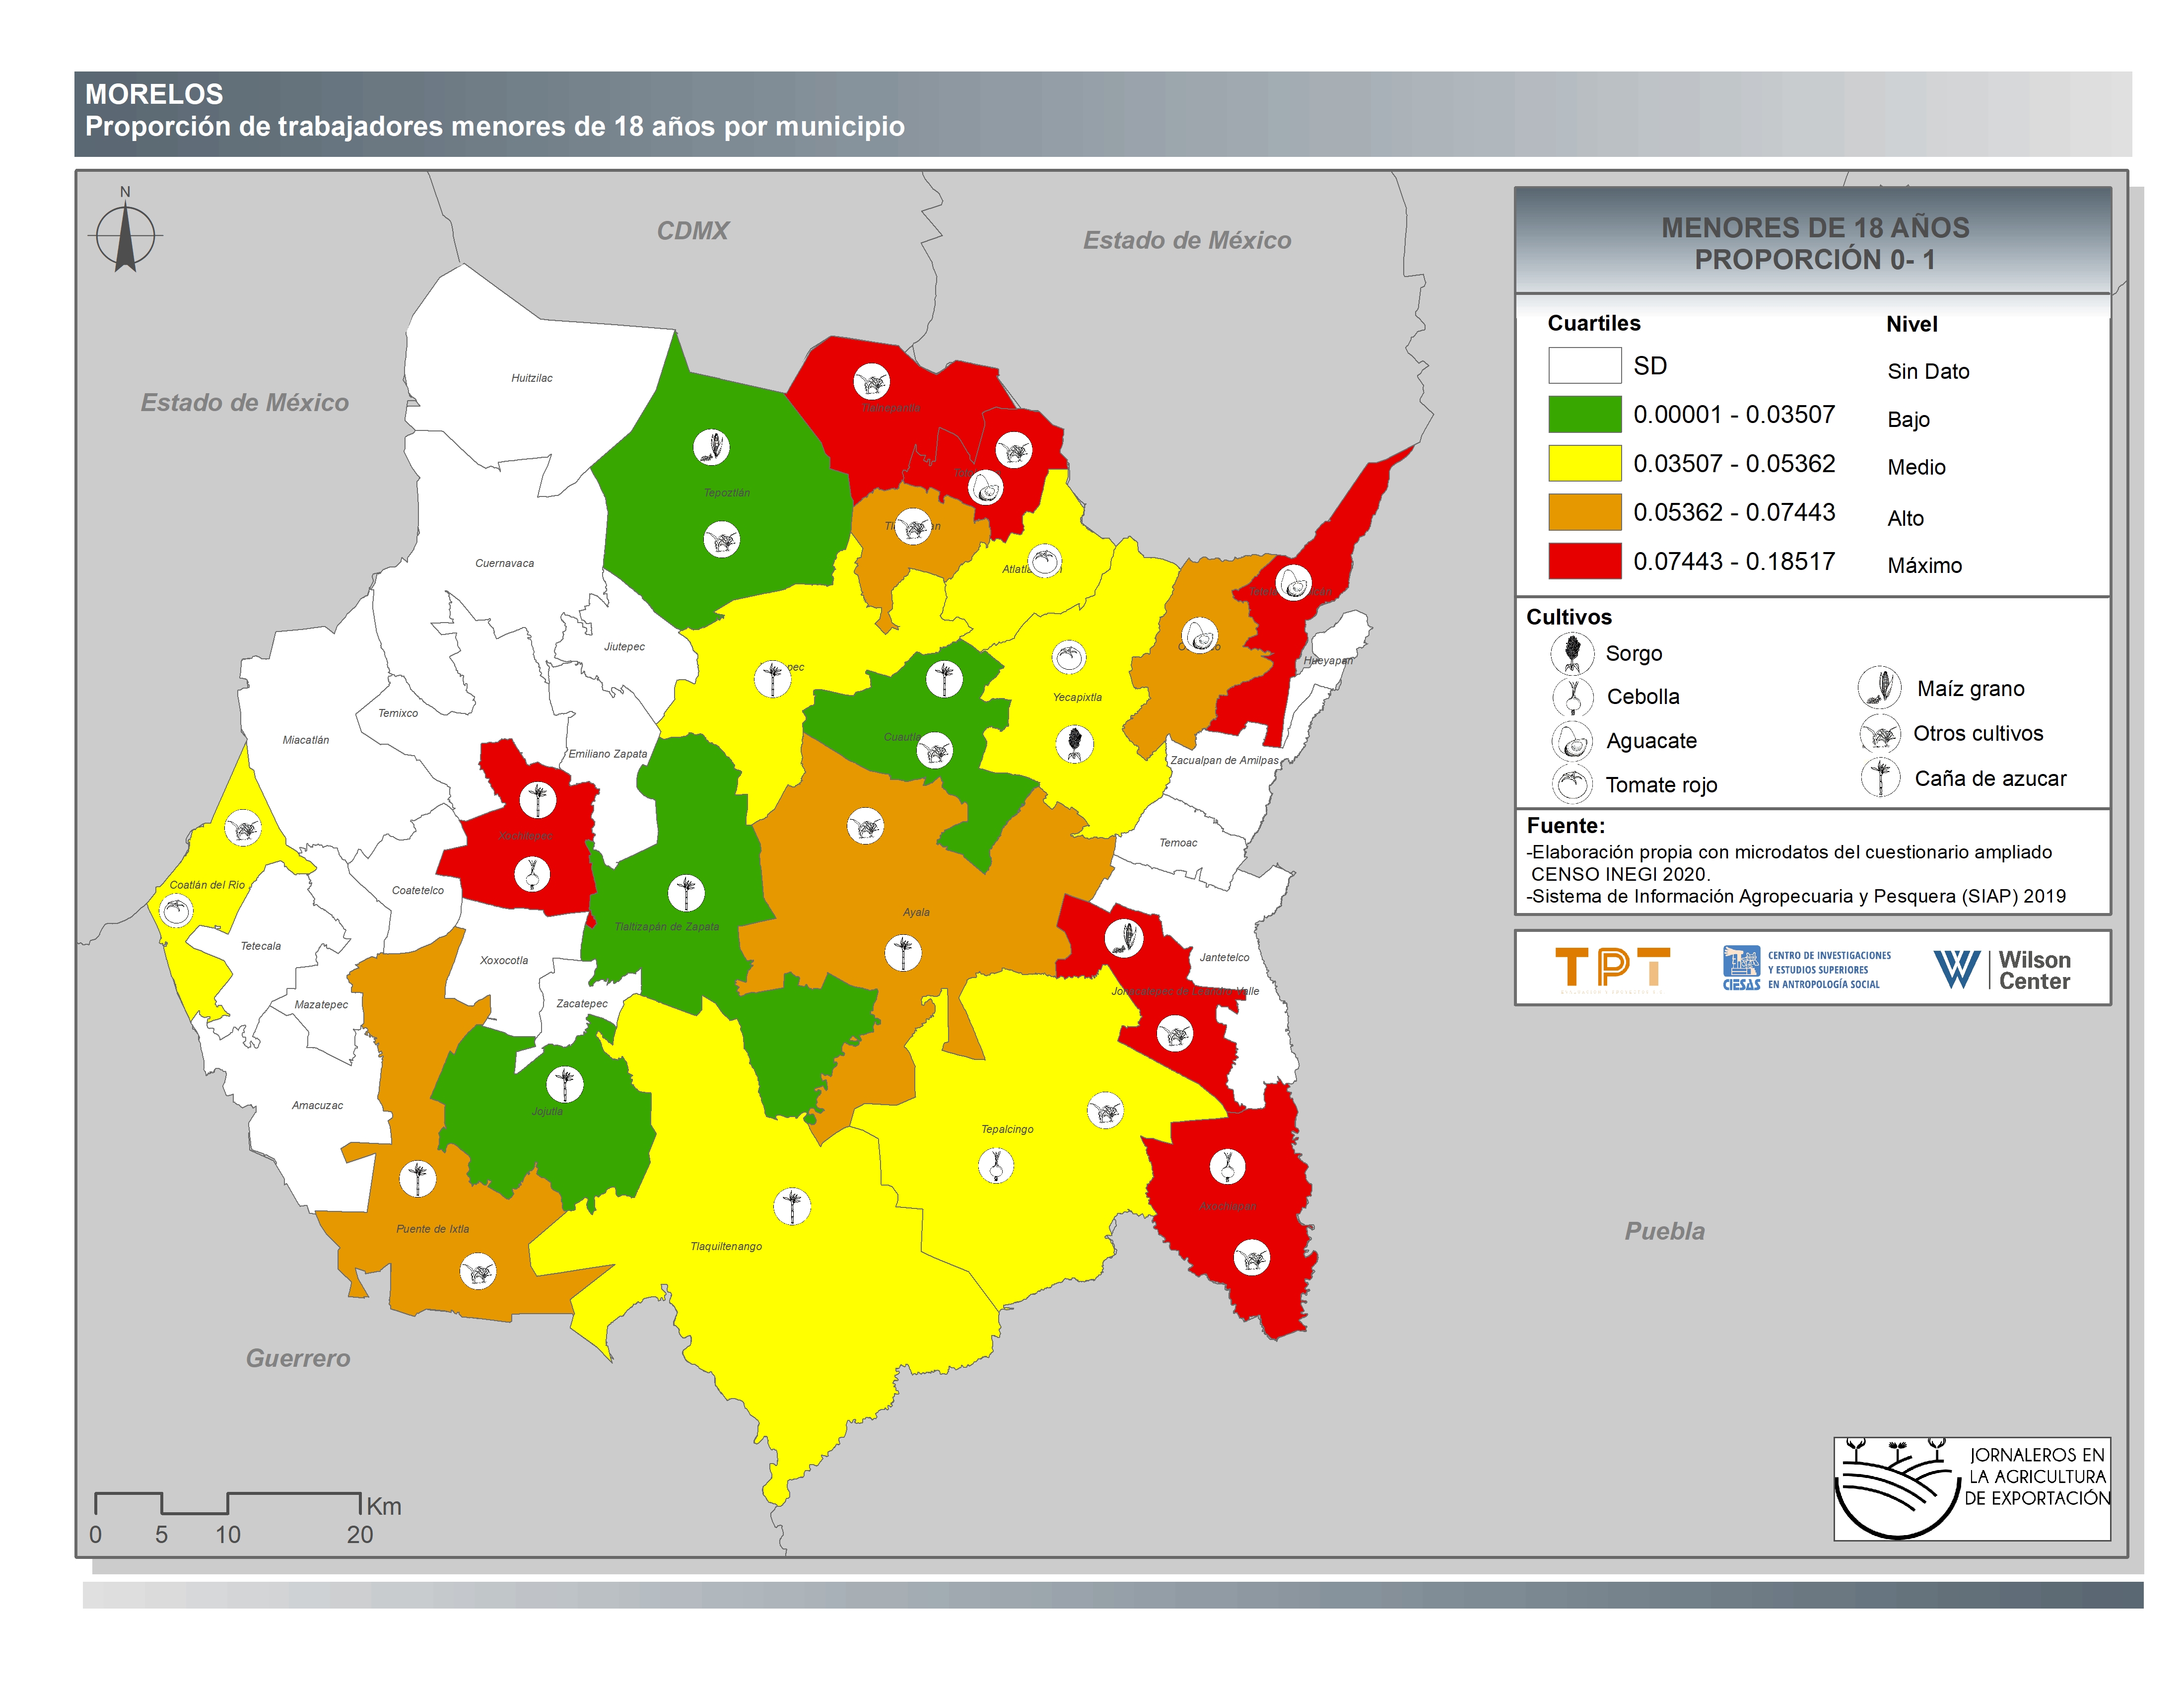
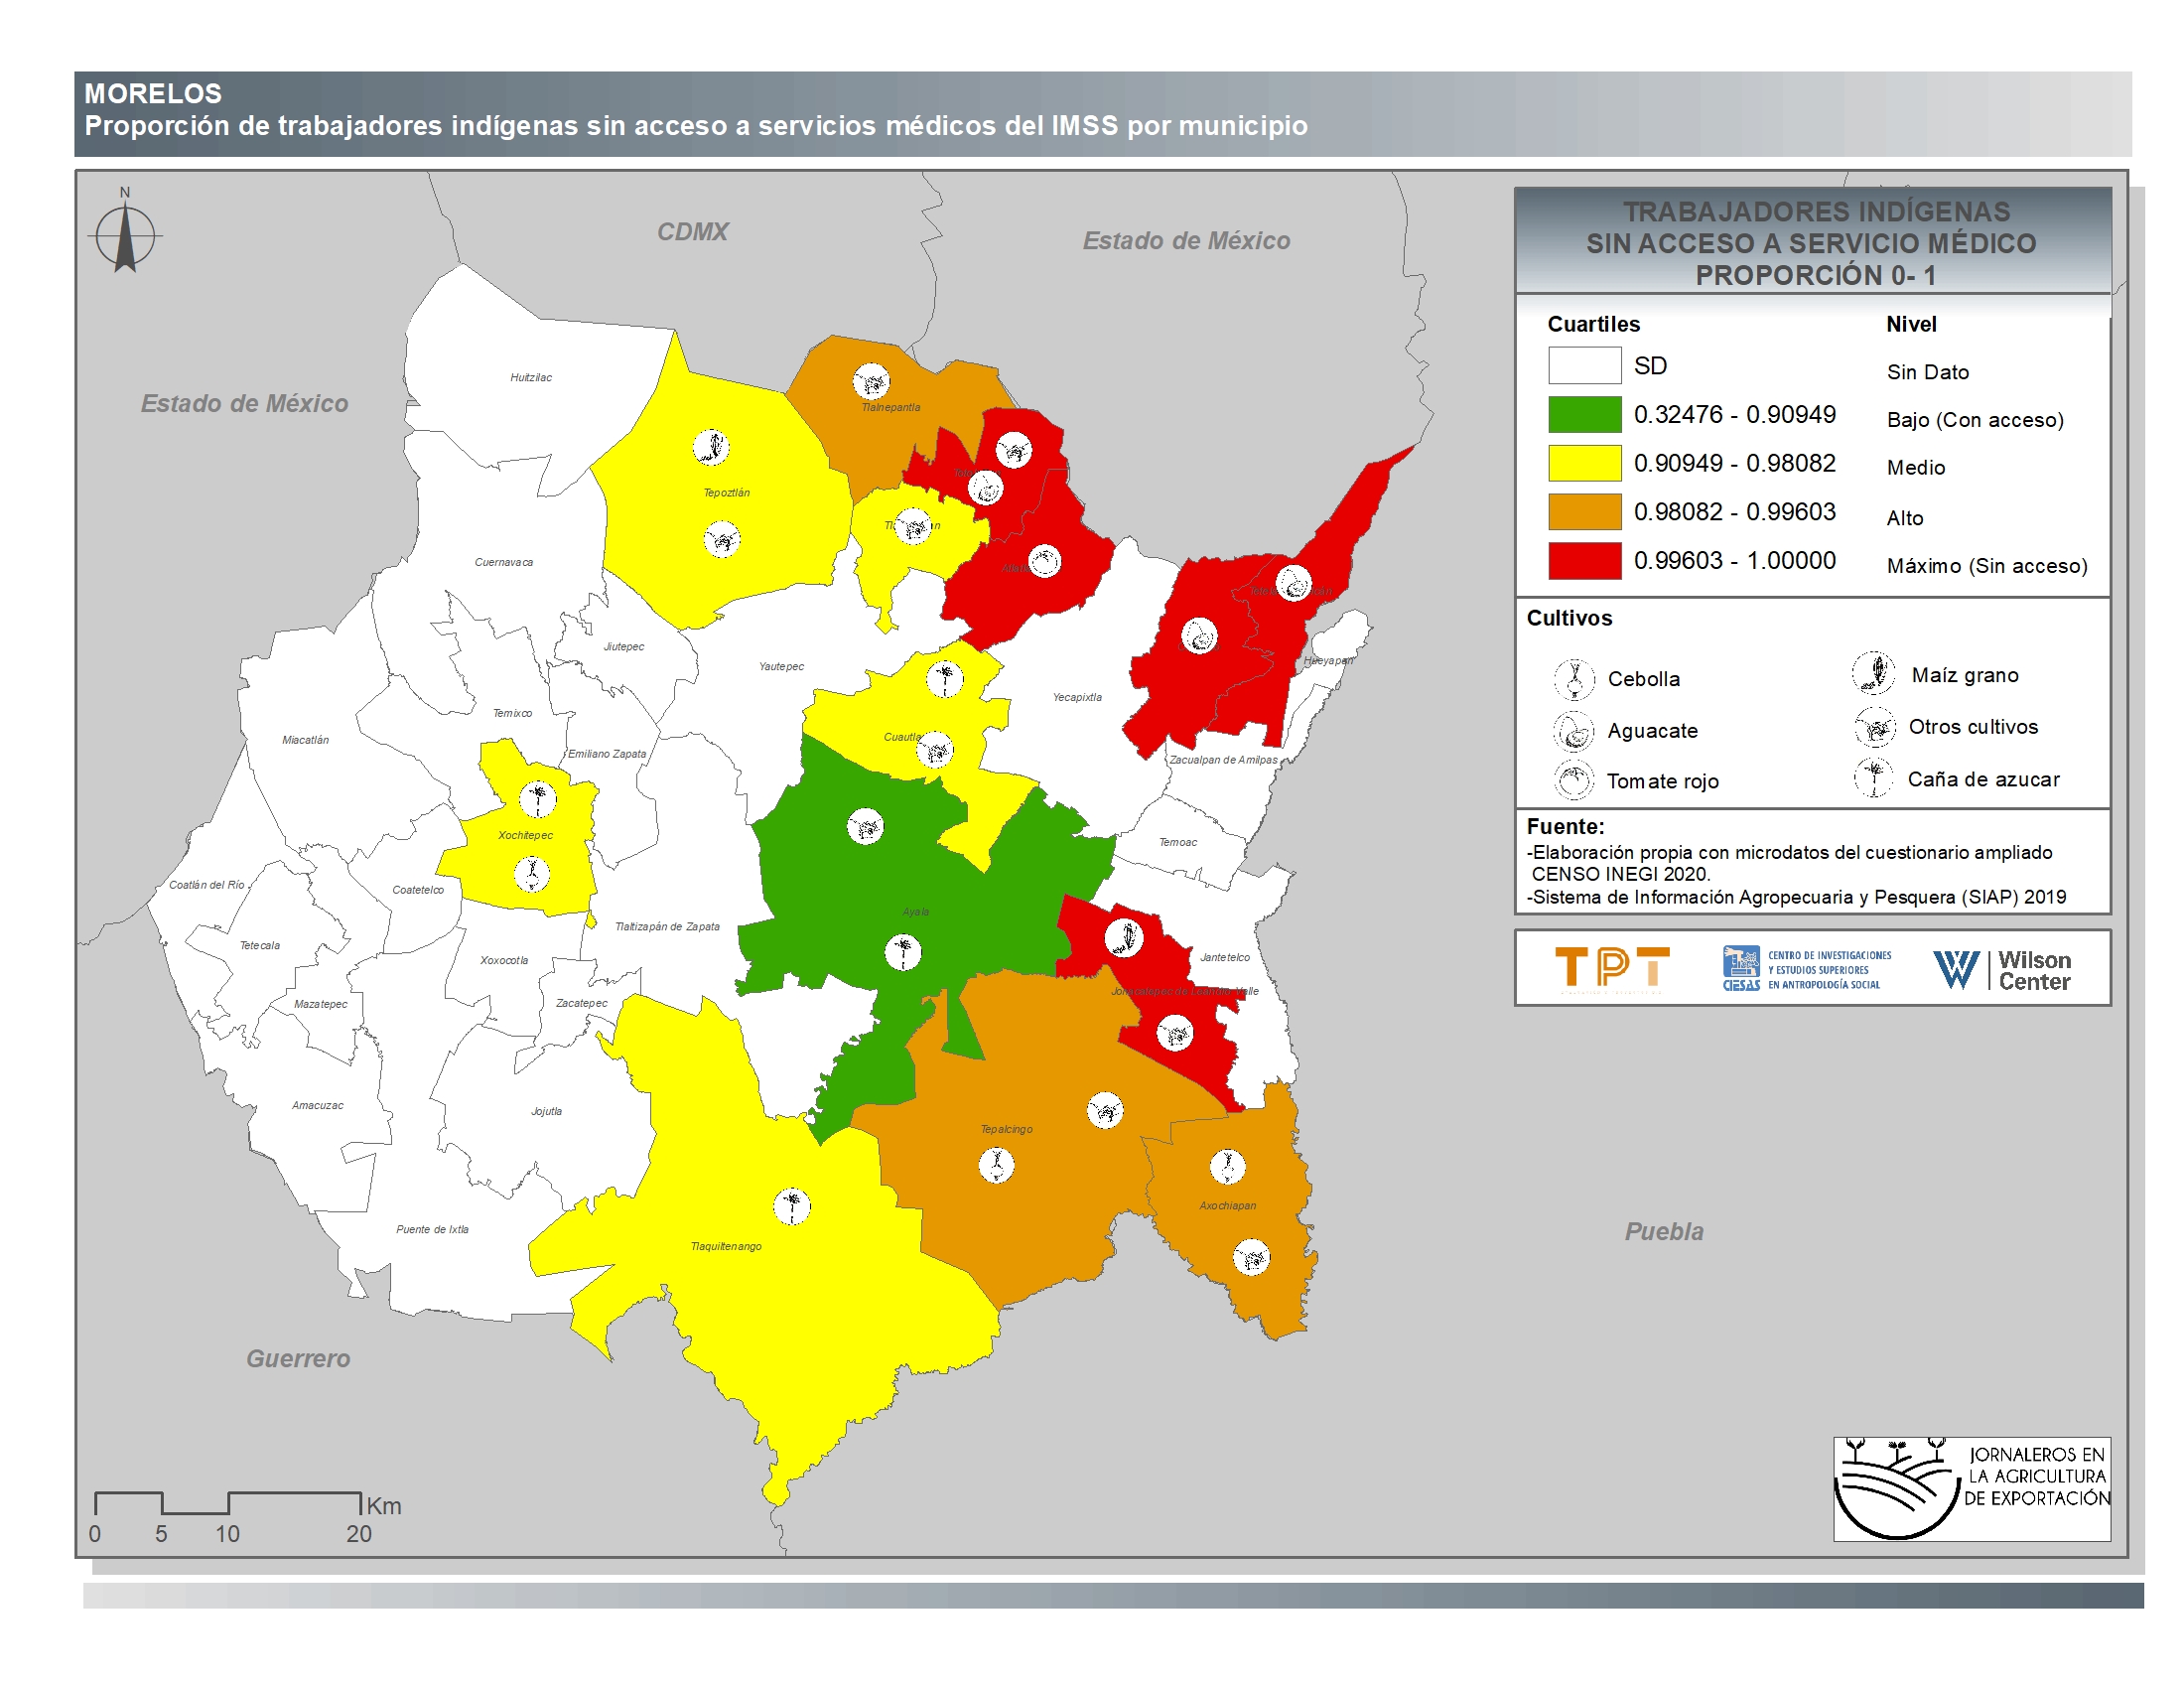
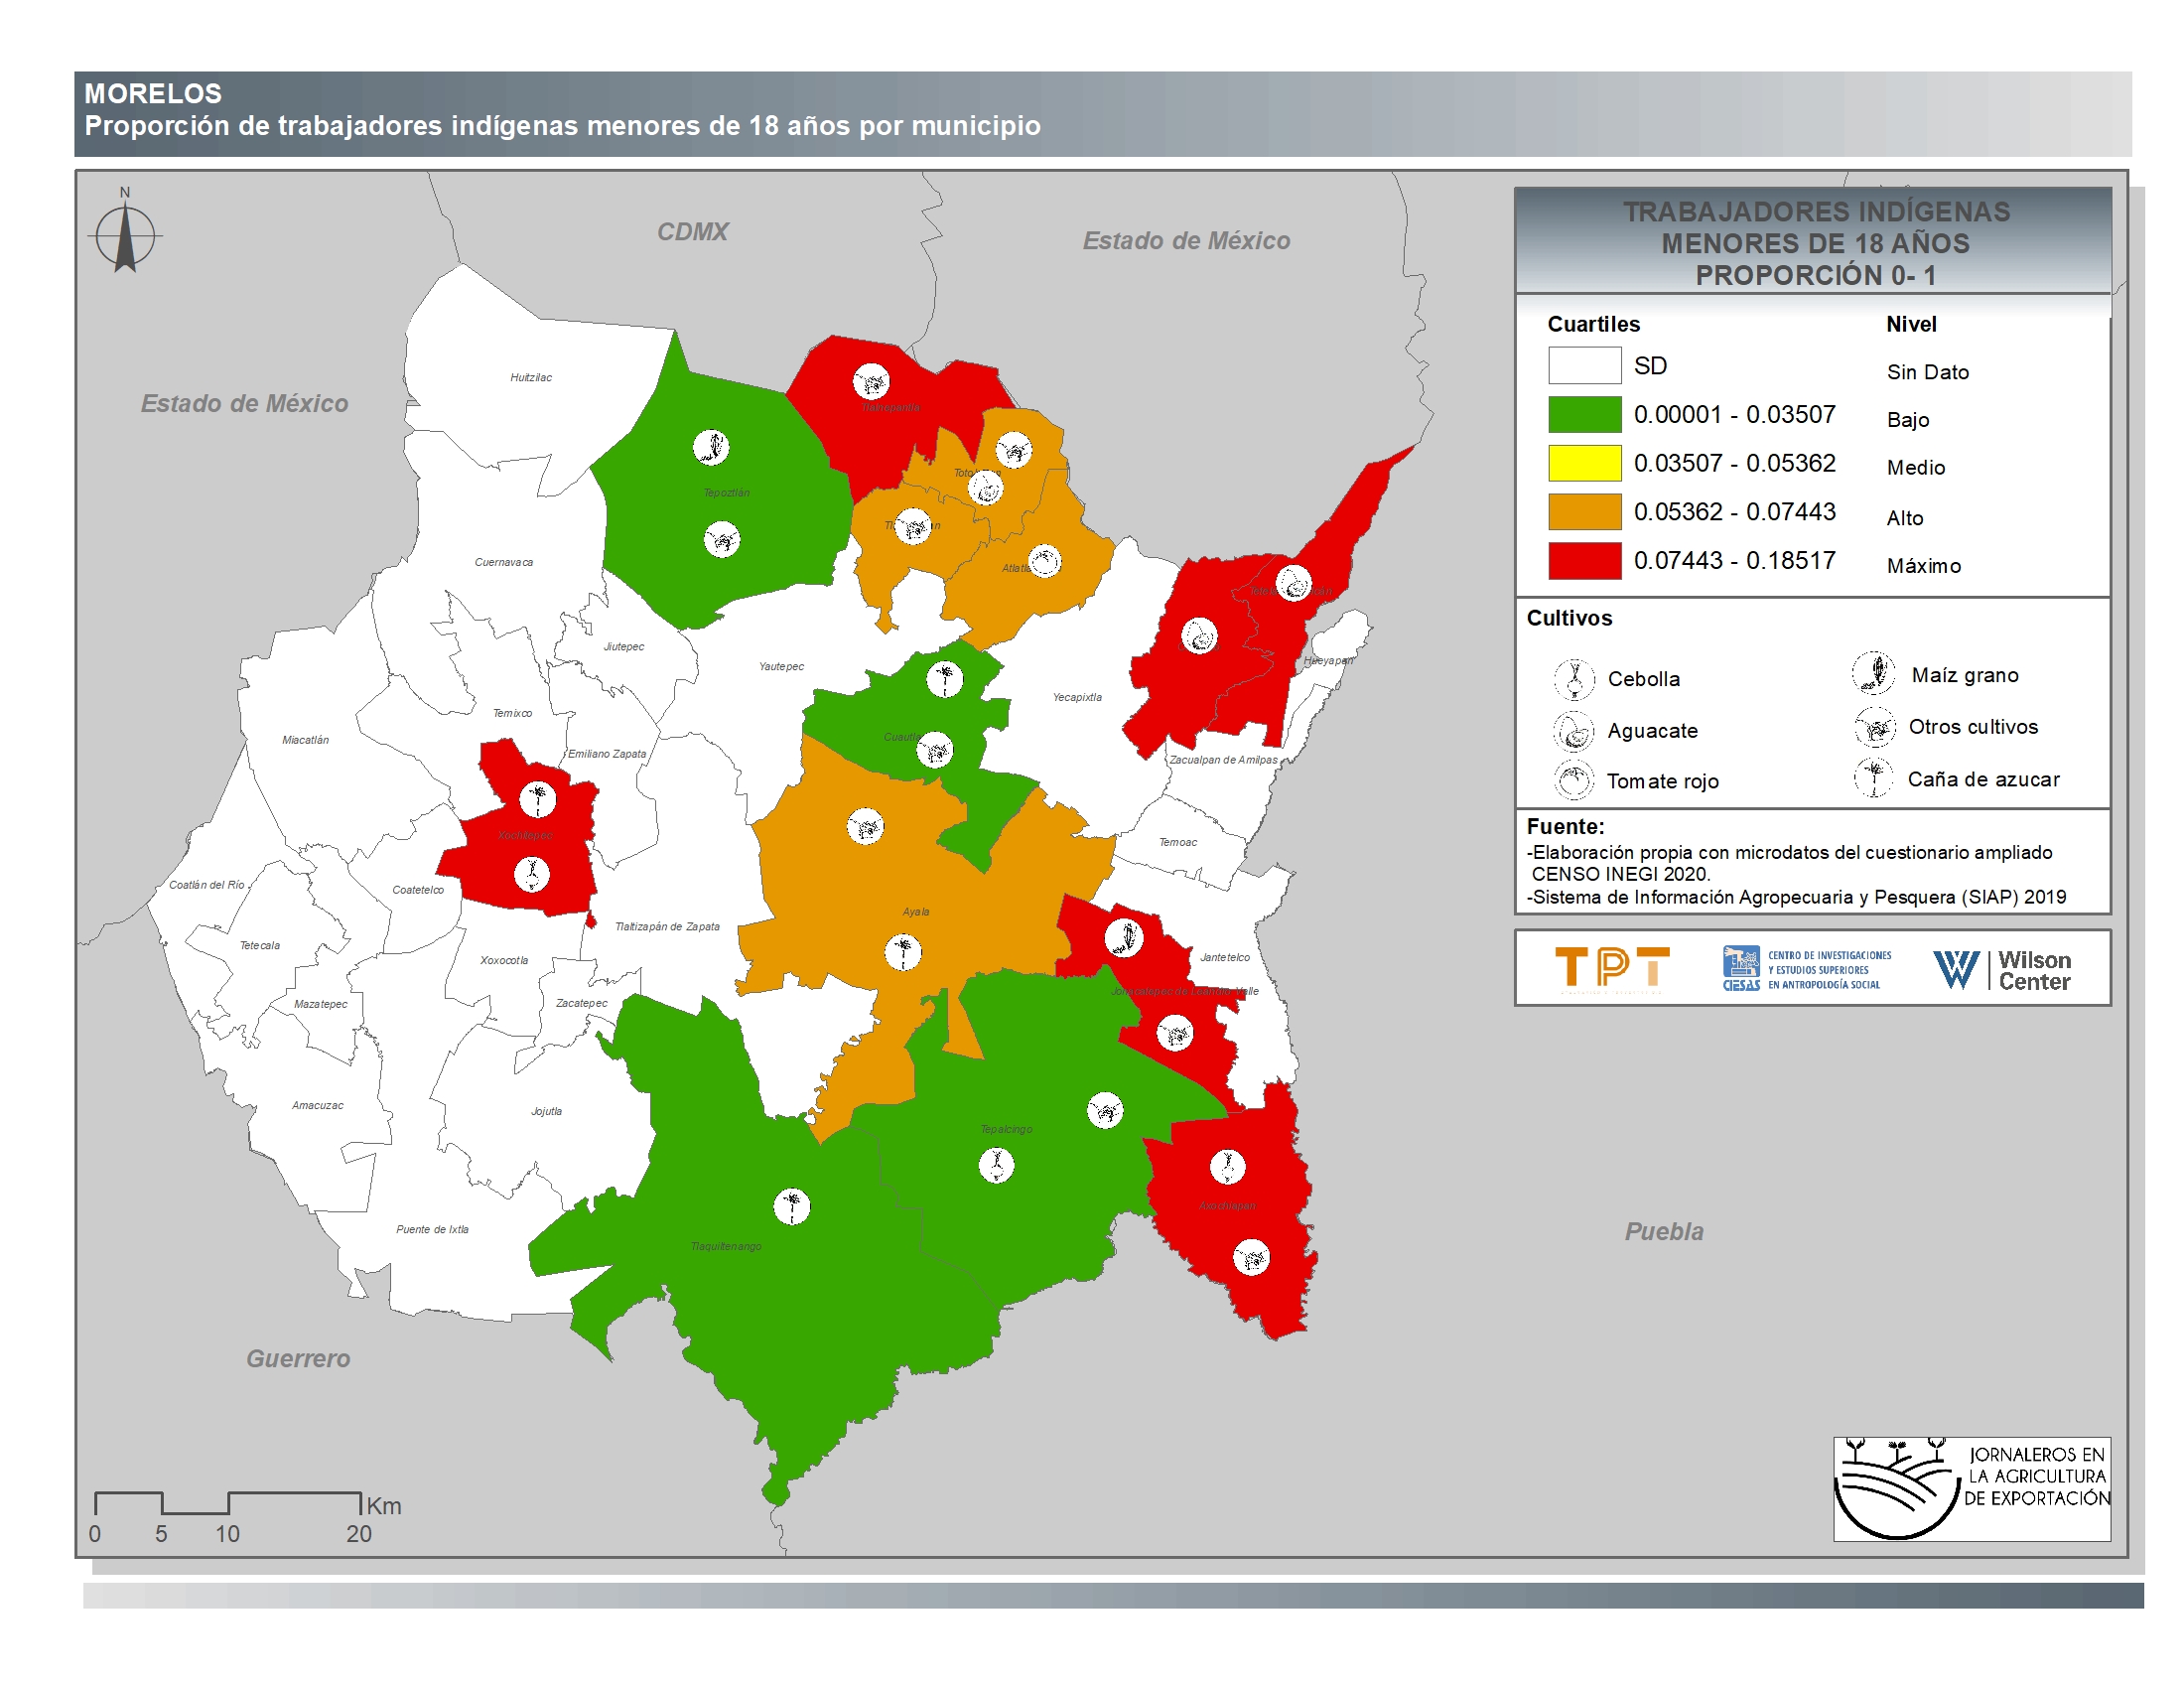
Morelos
-
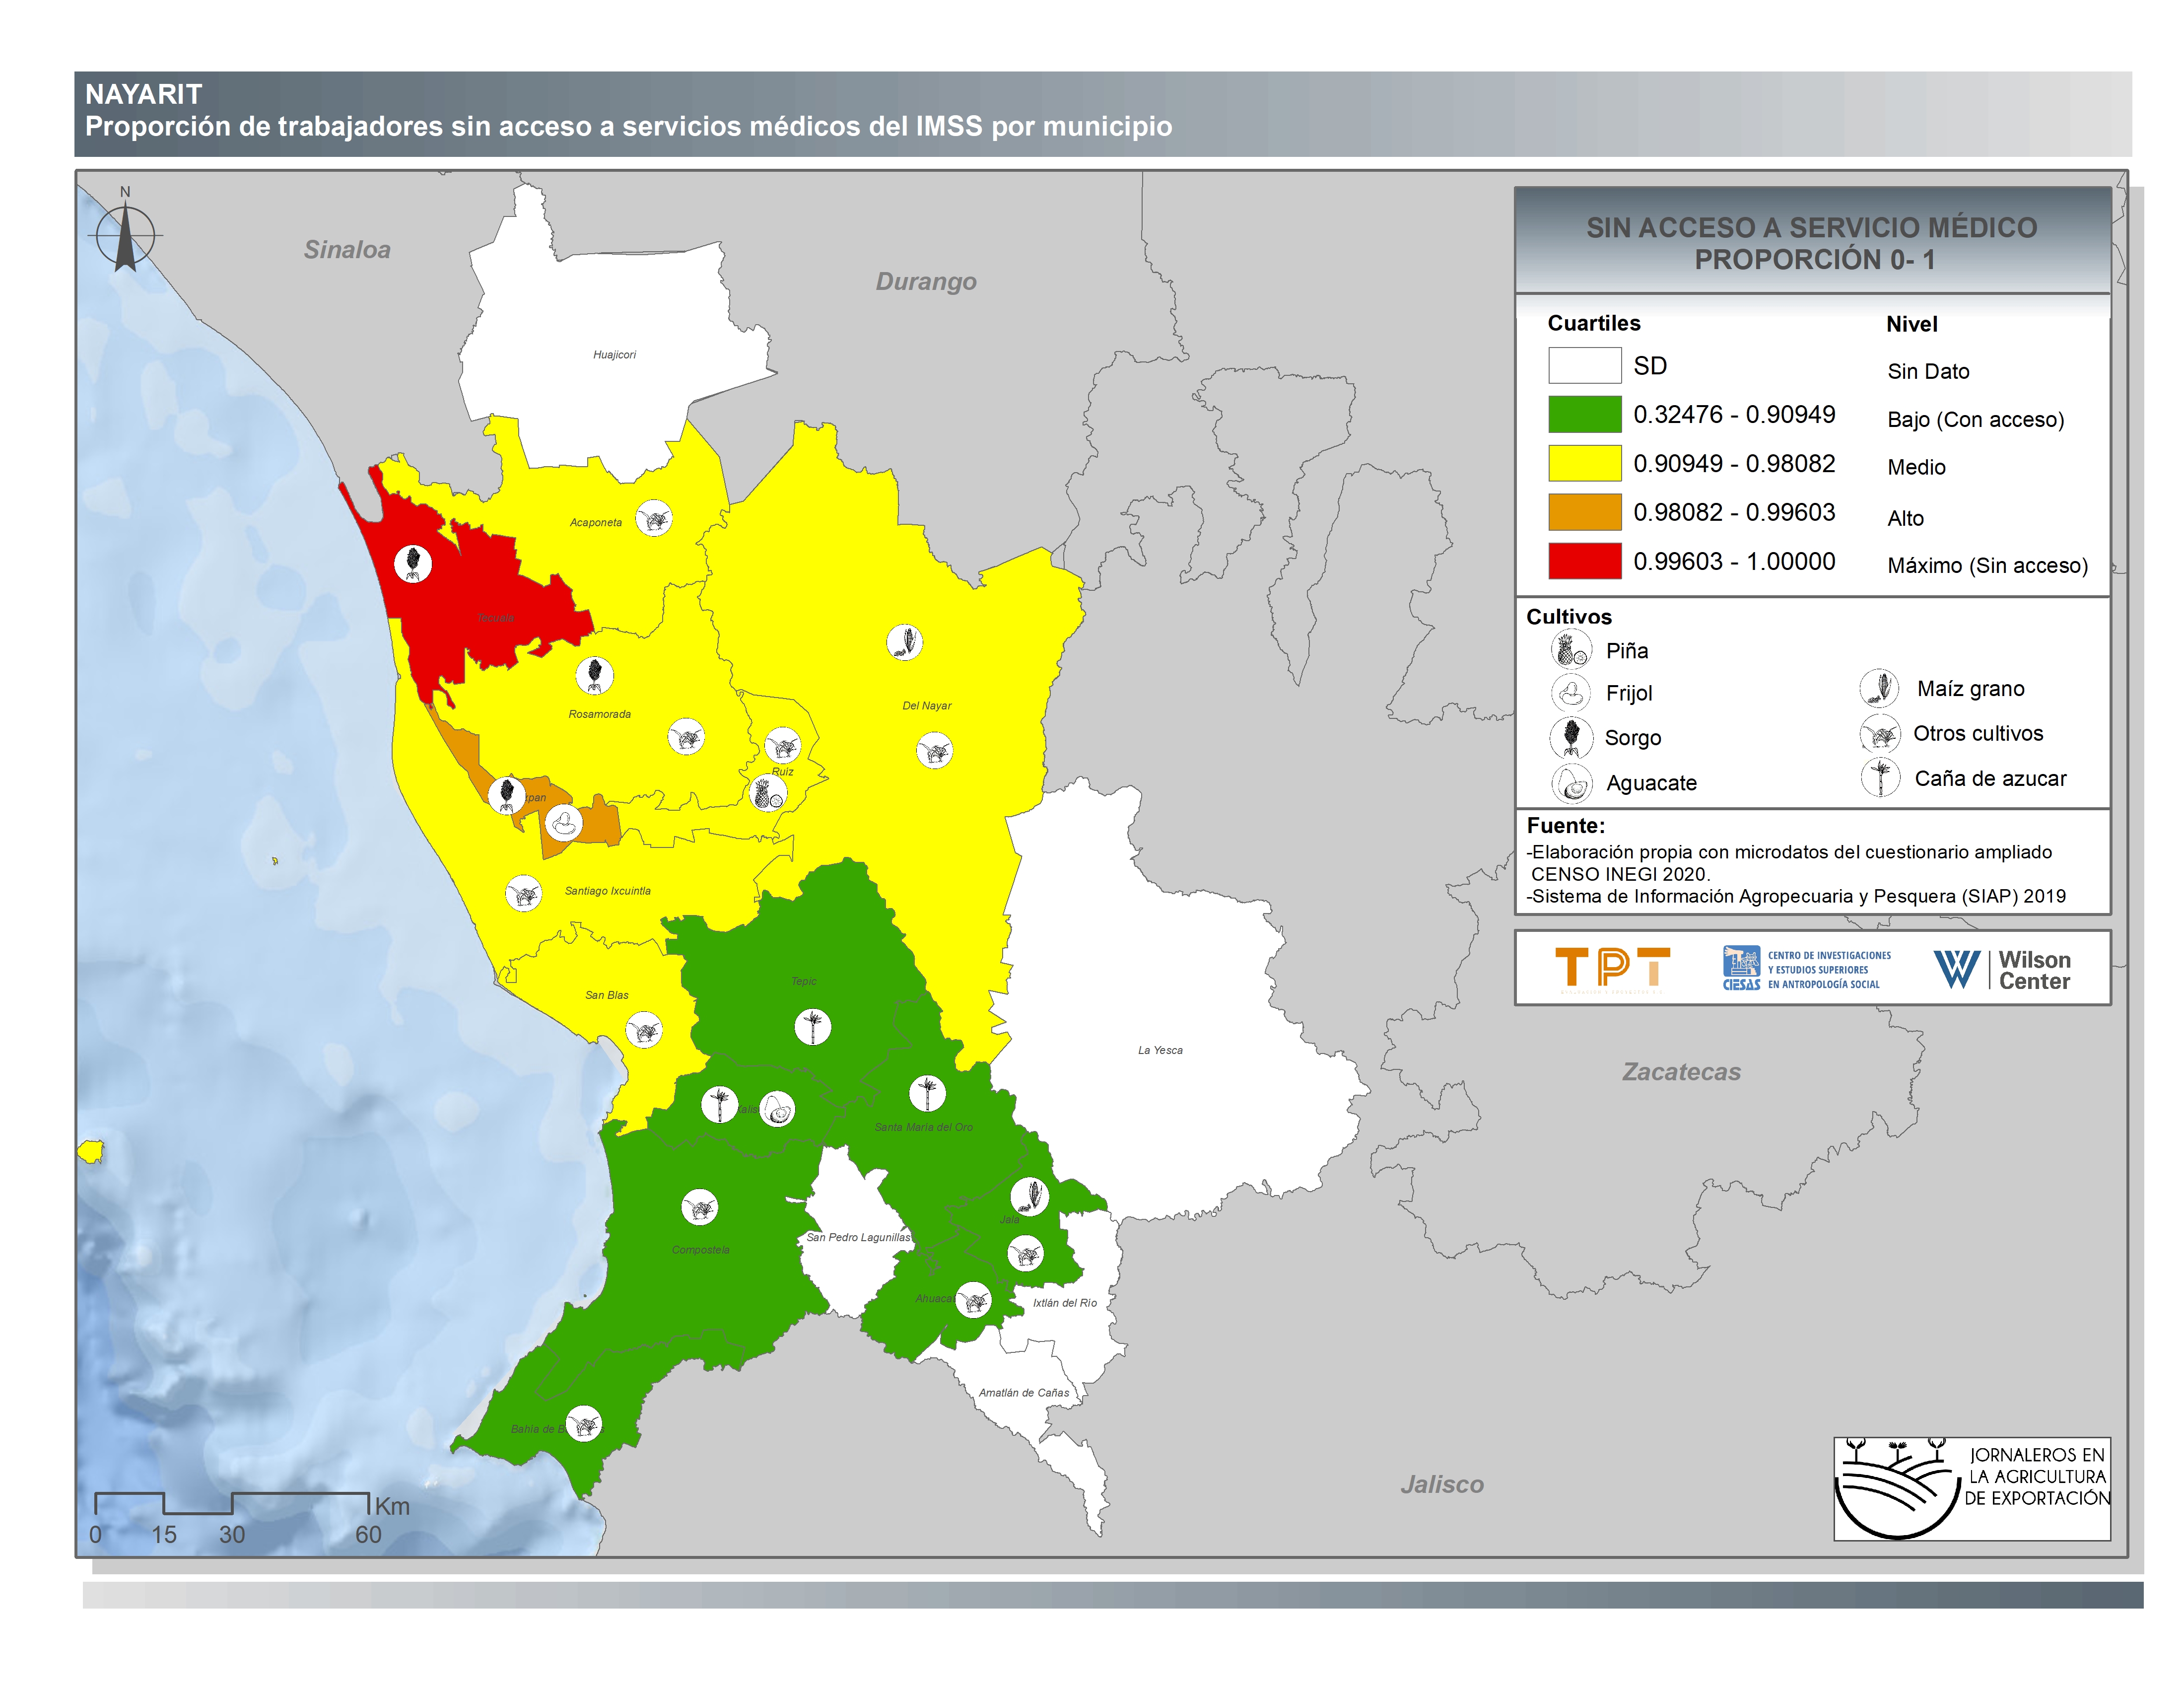
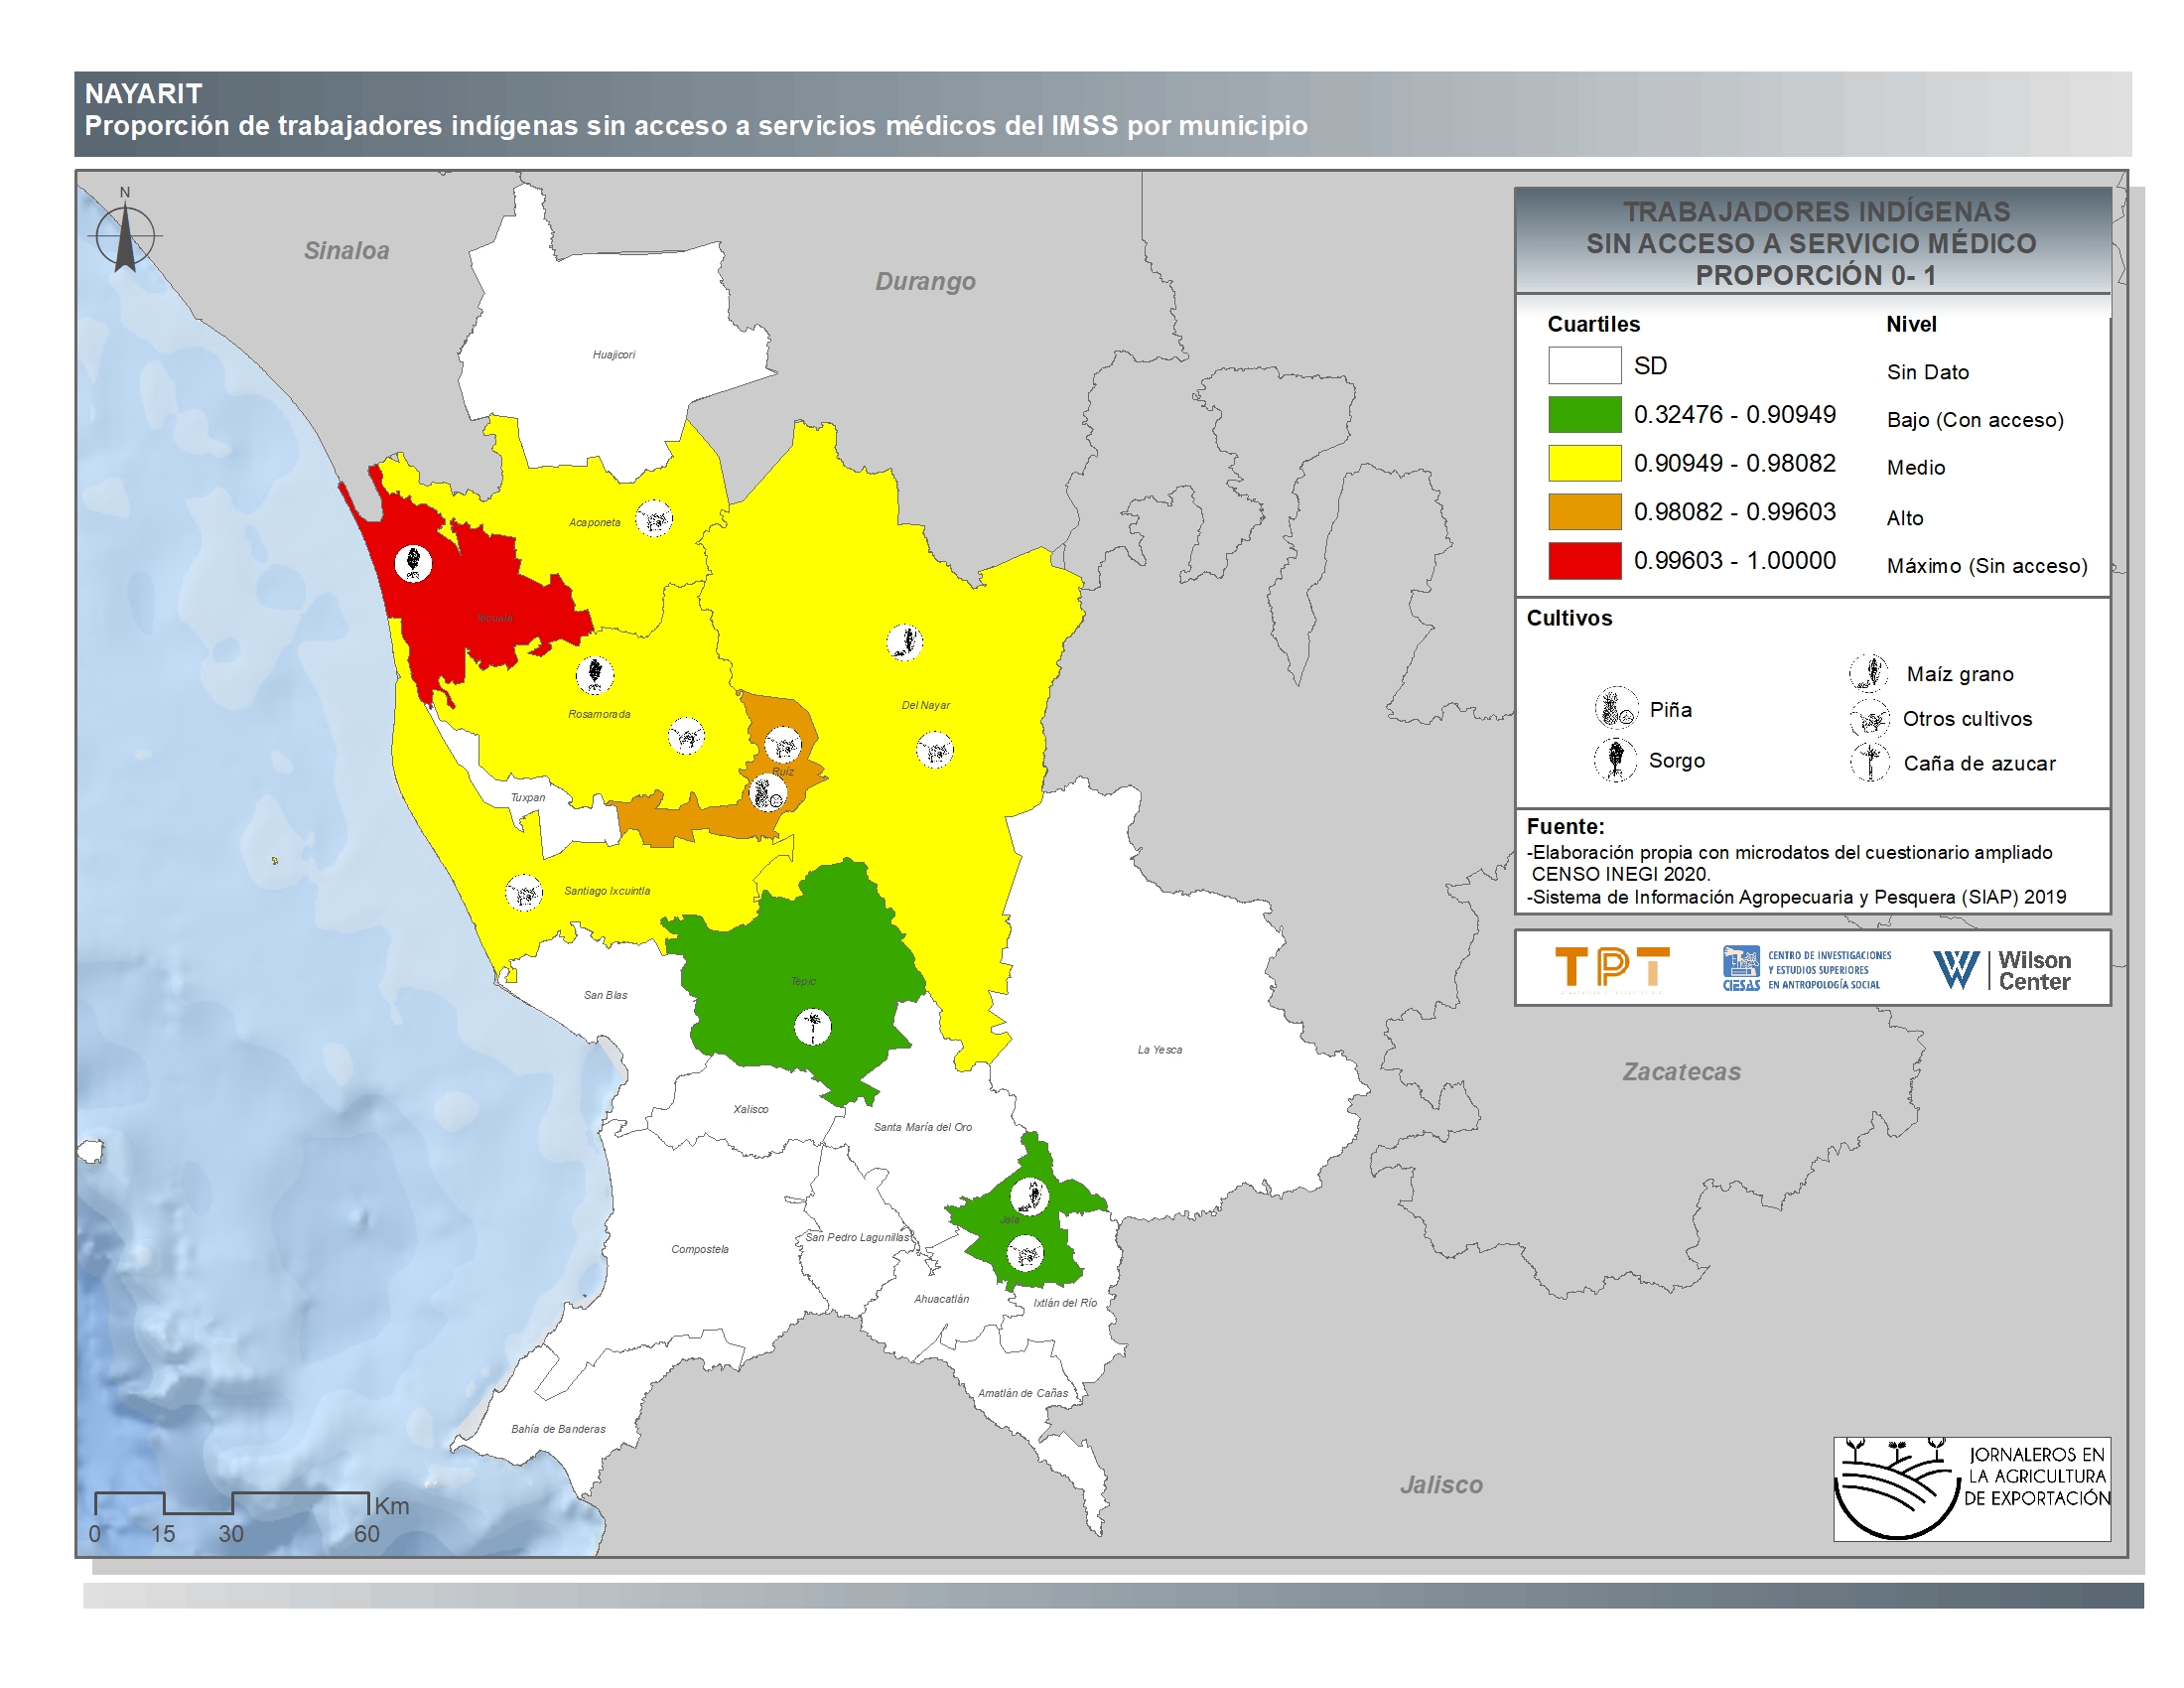
Nayarit
-
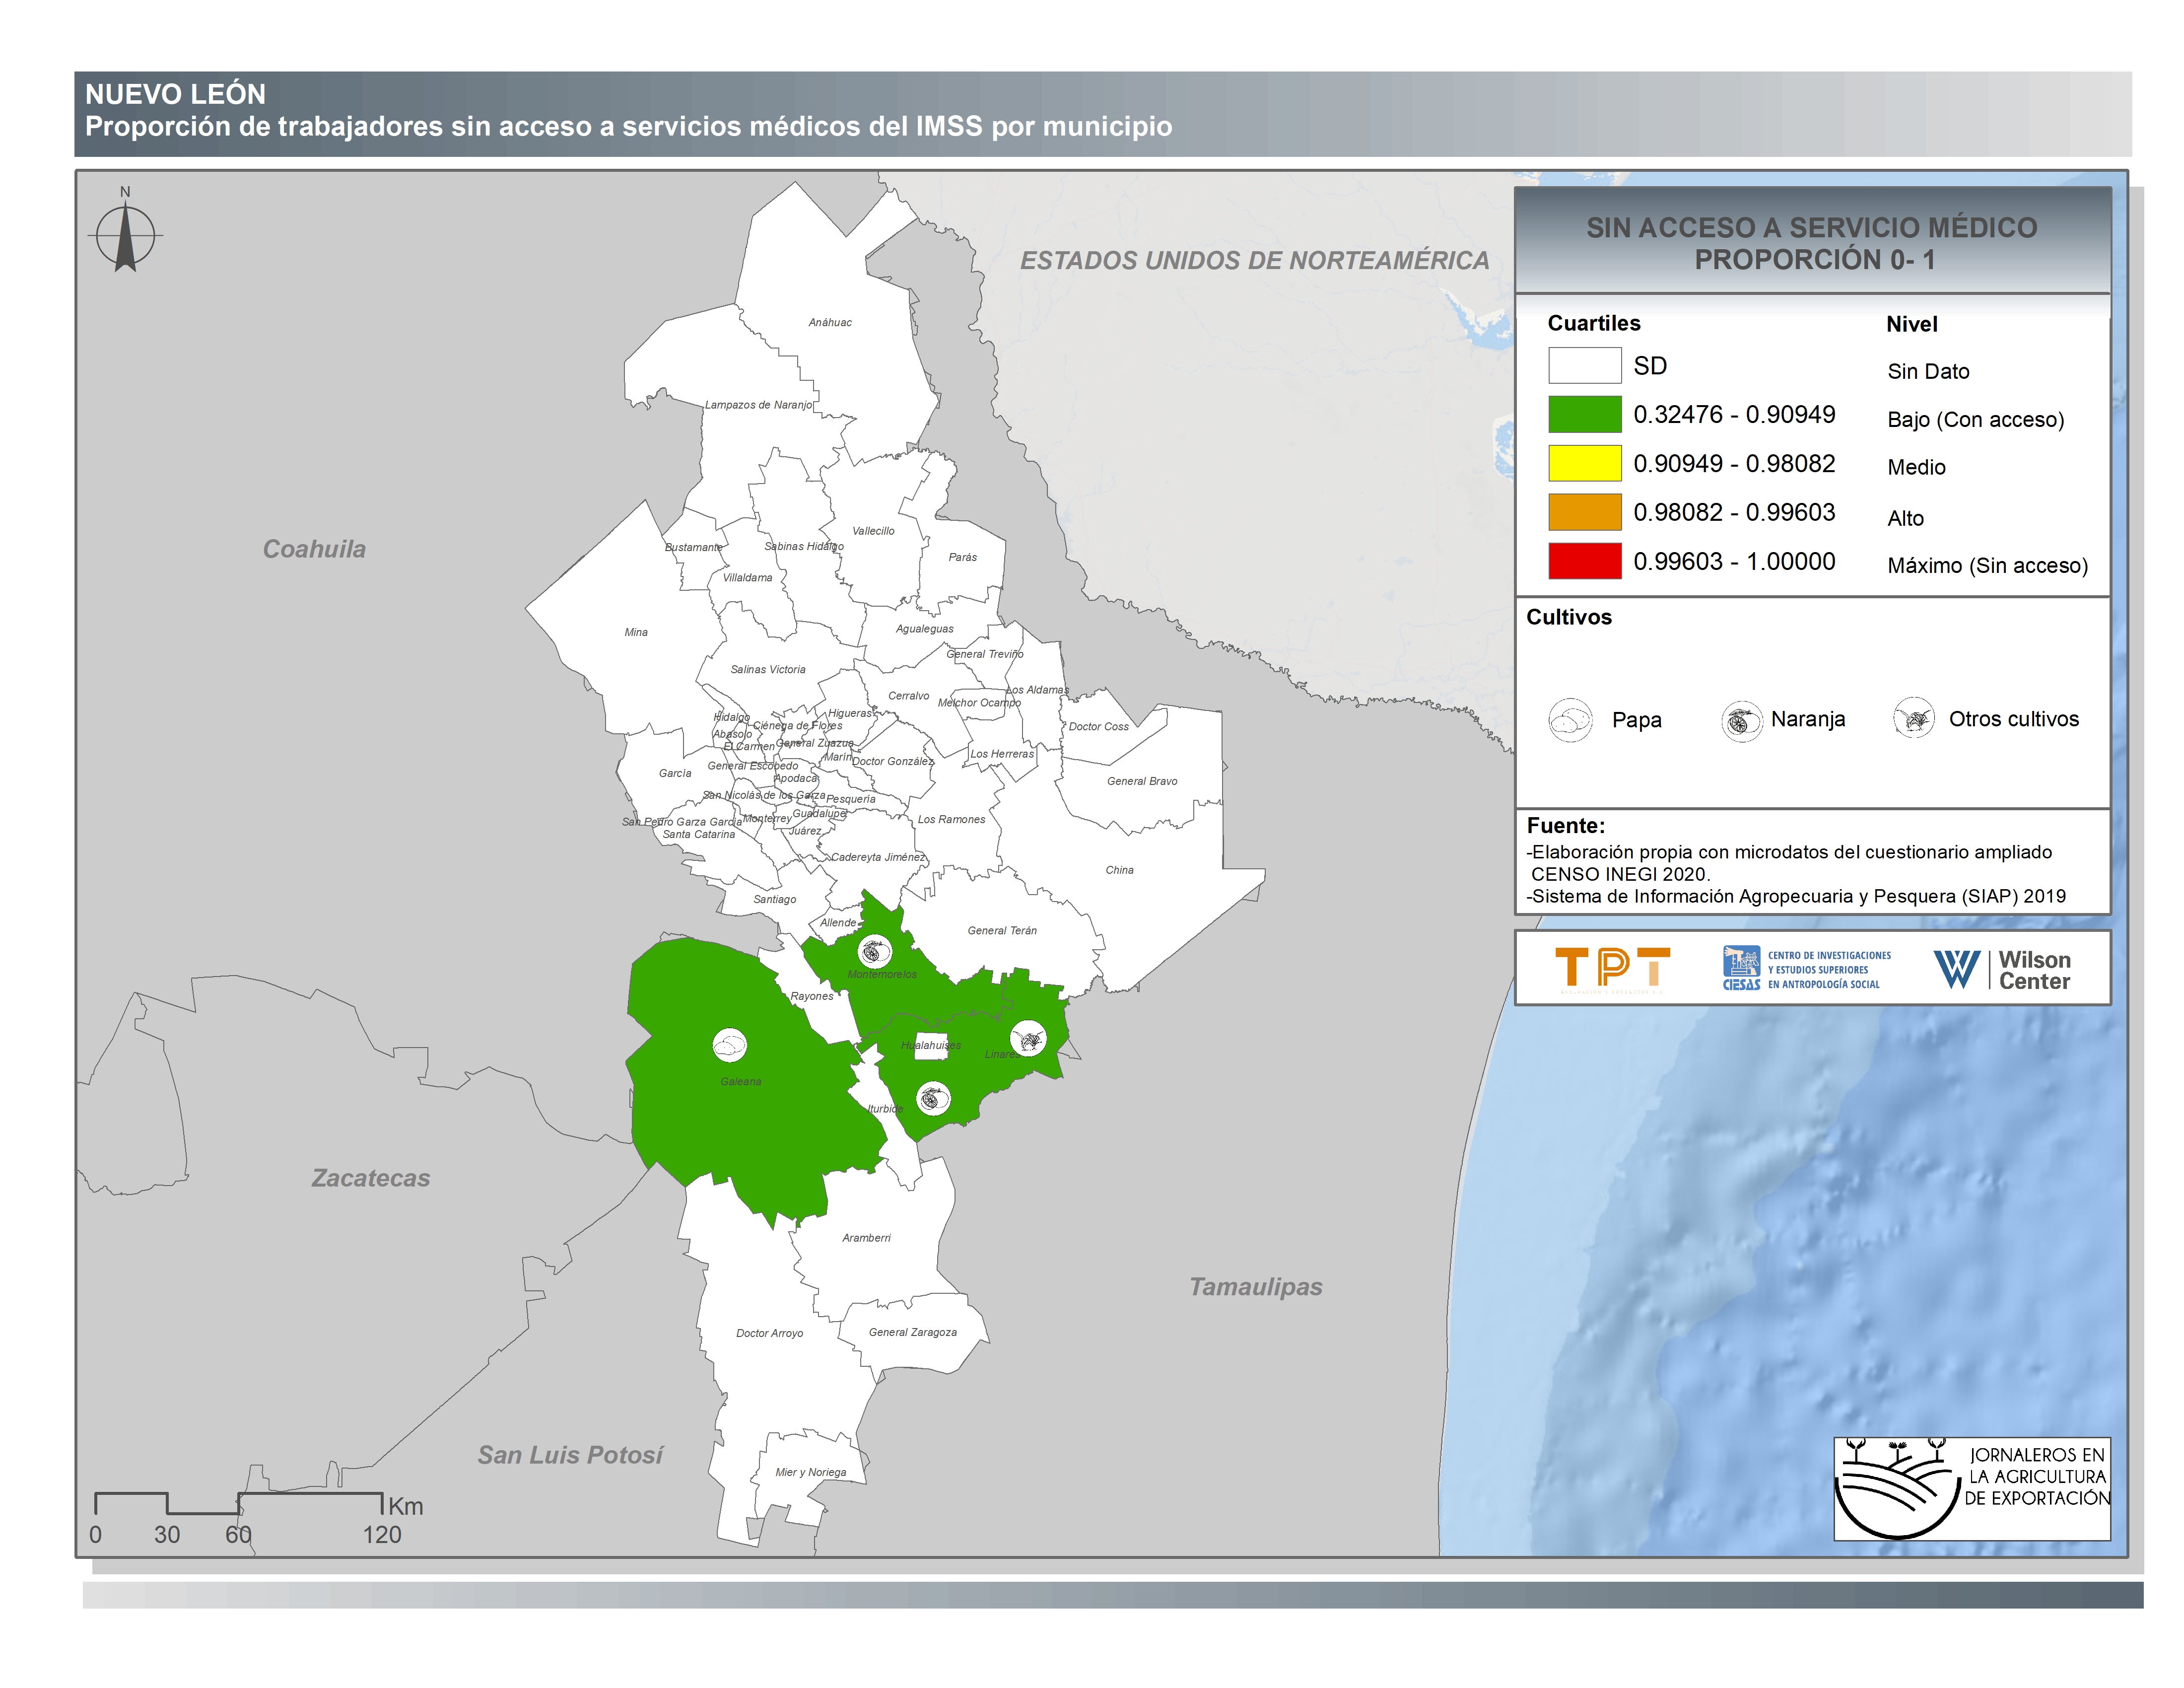
Nuevo León
-
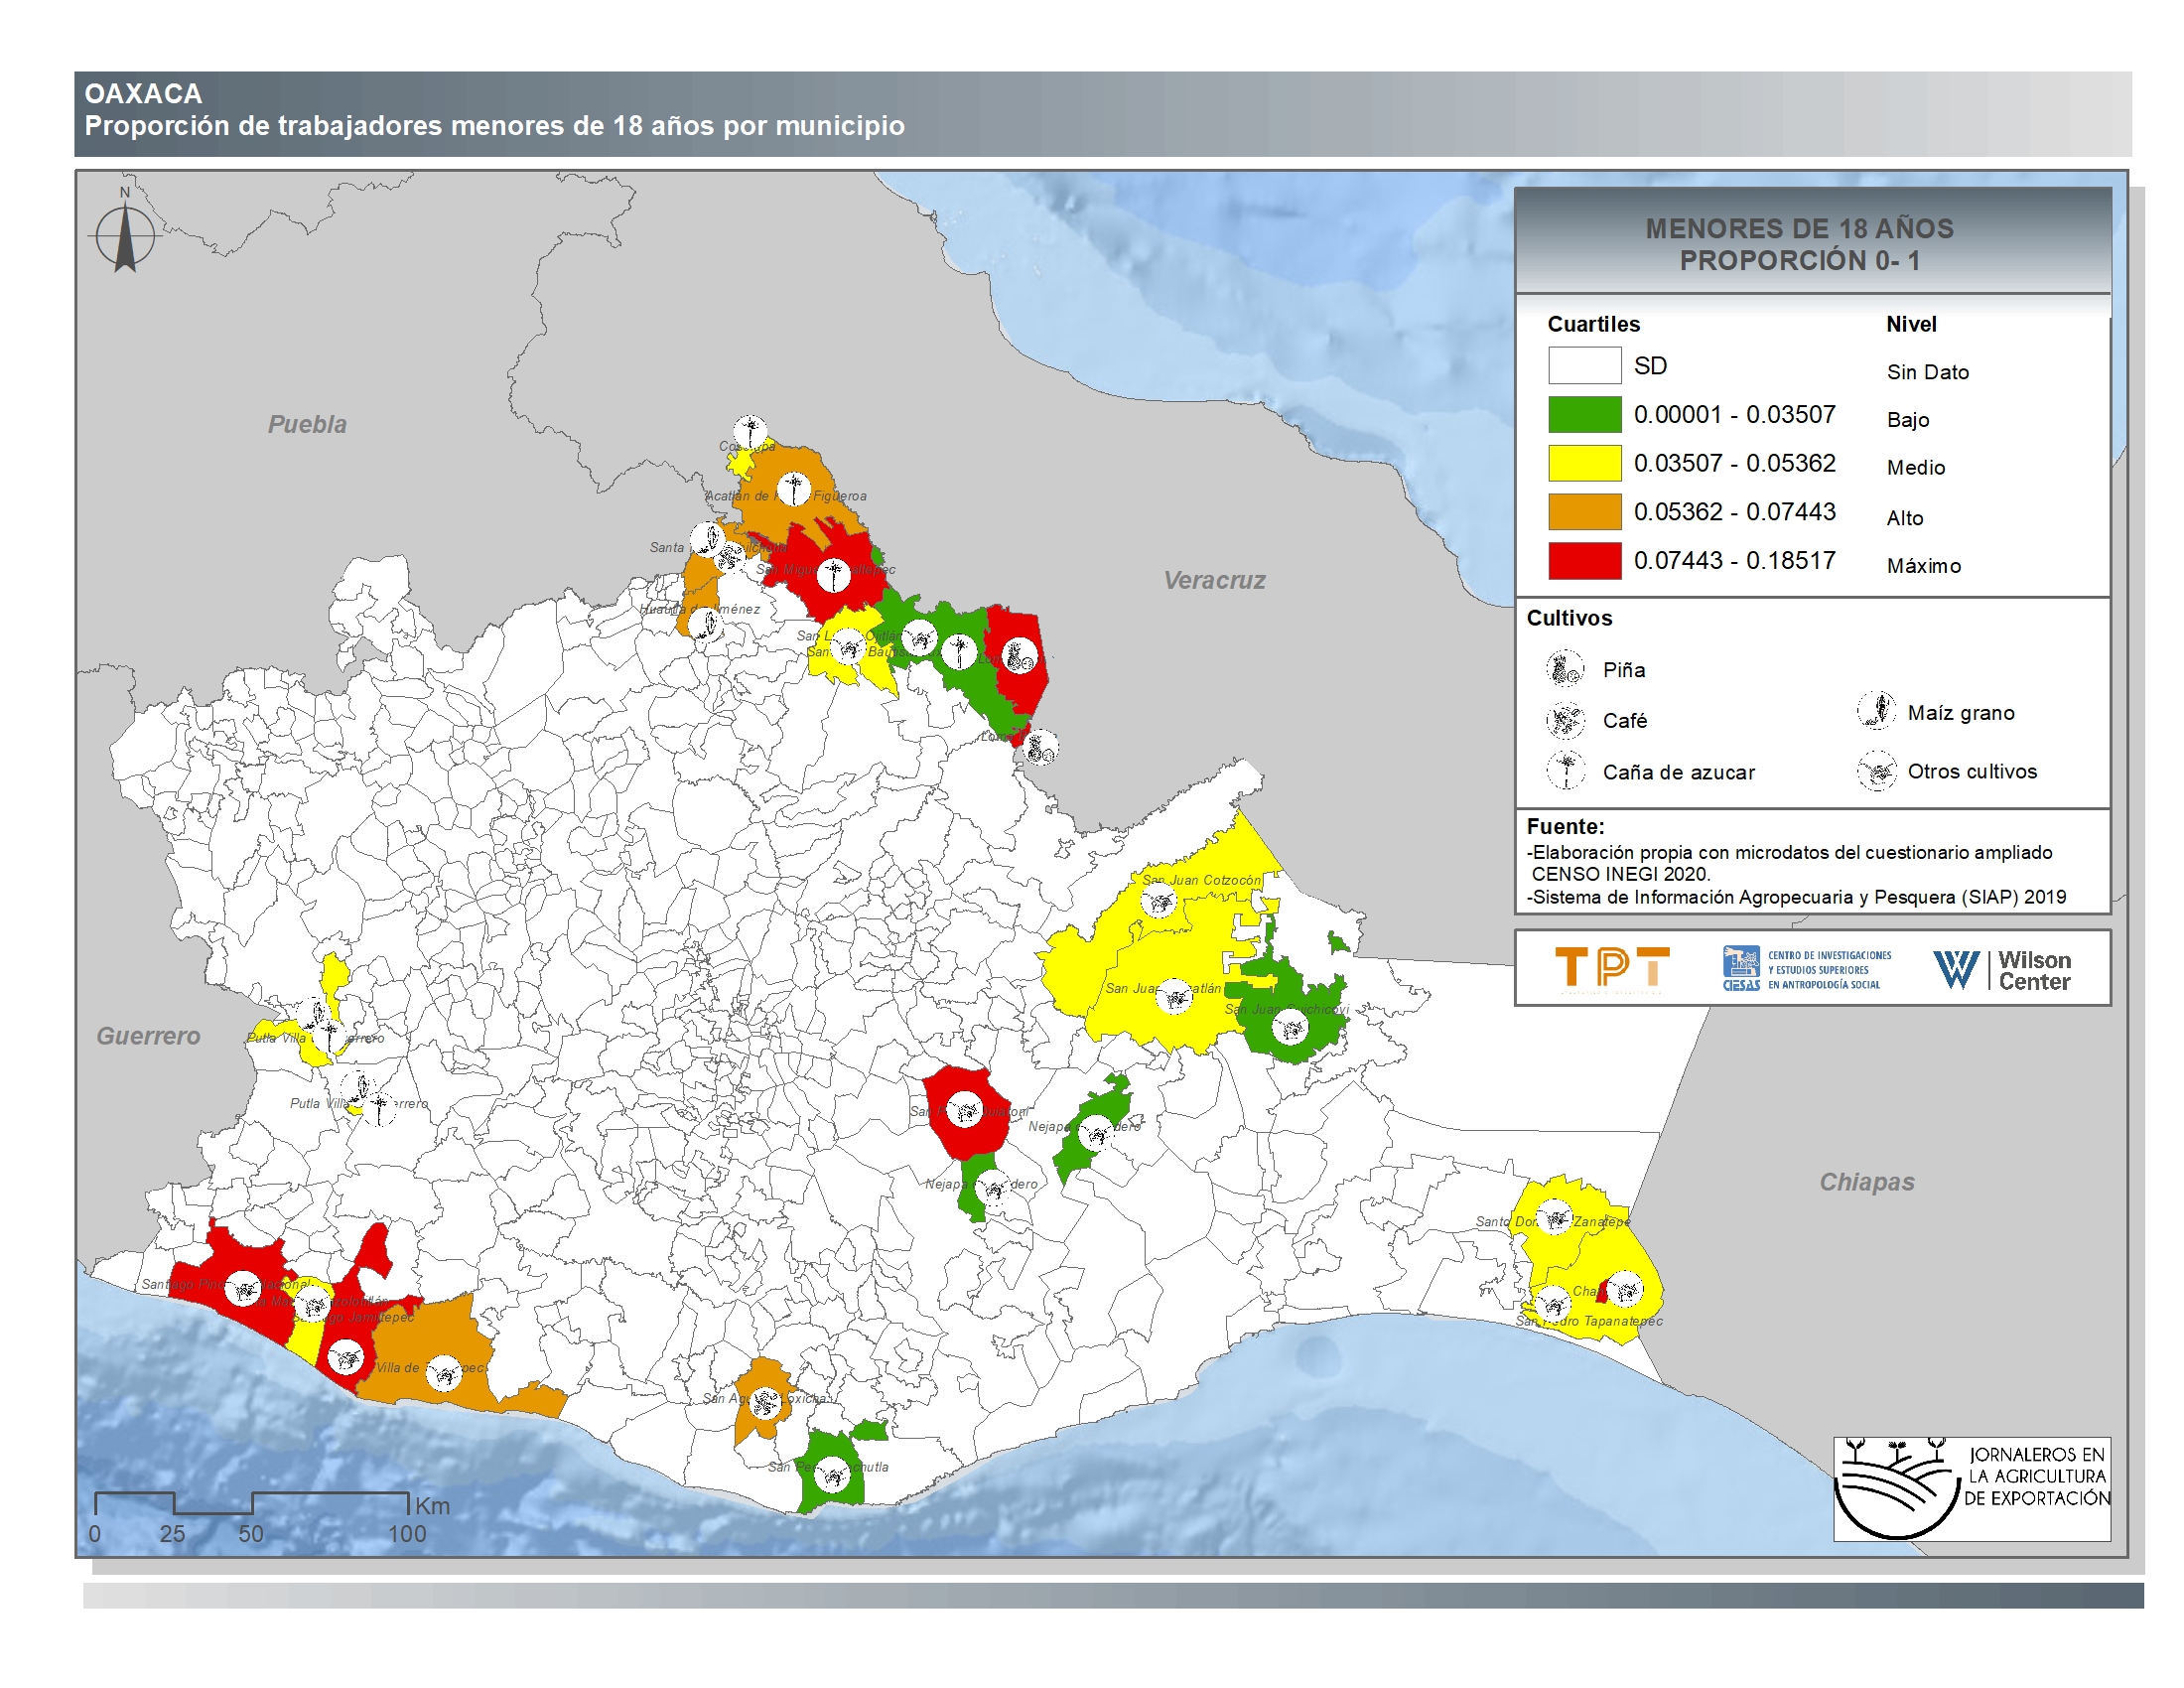
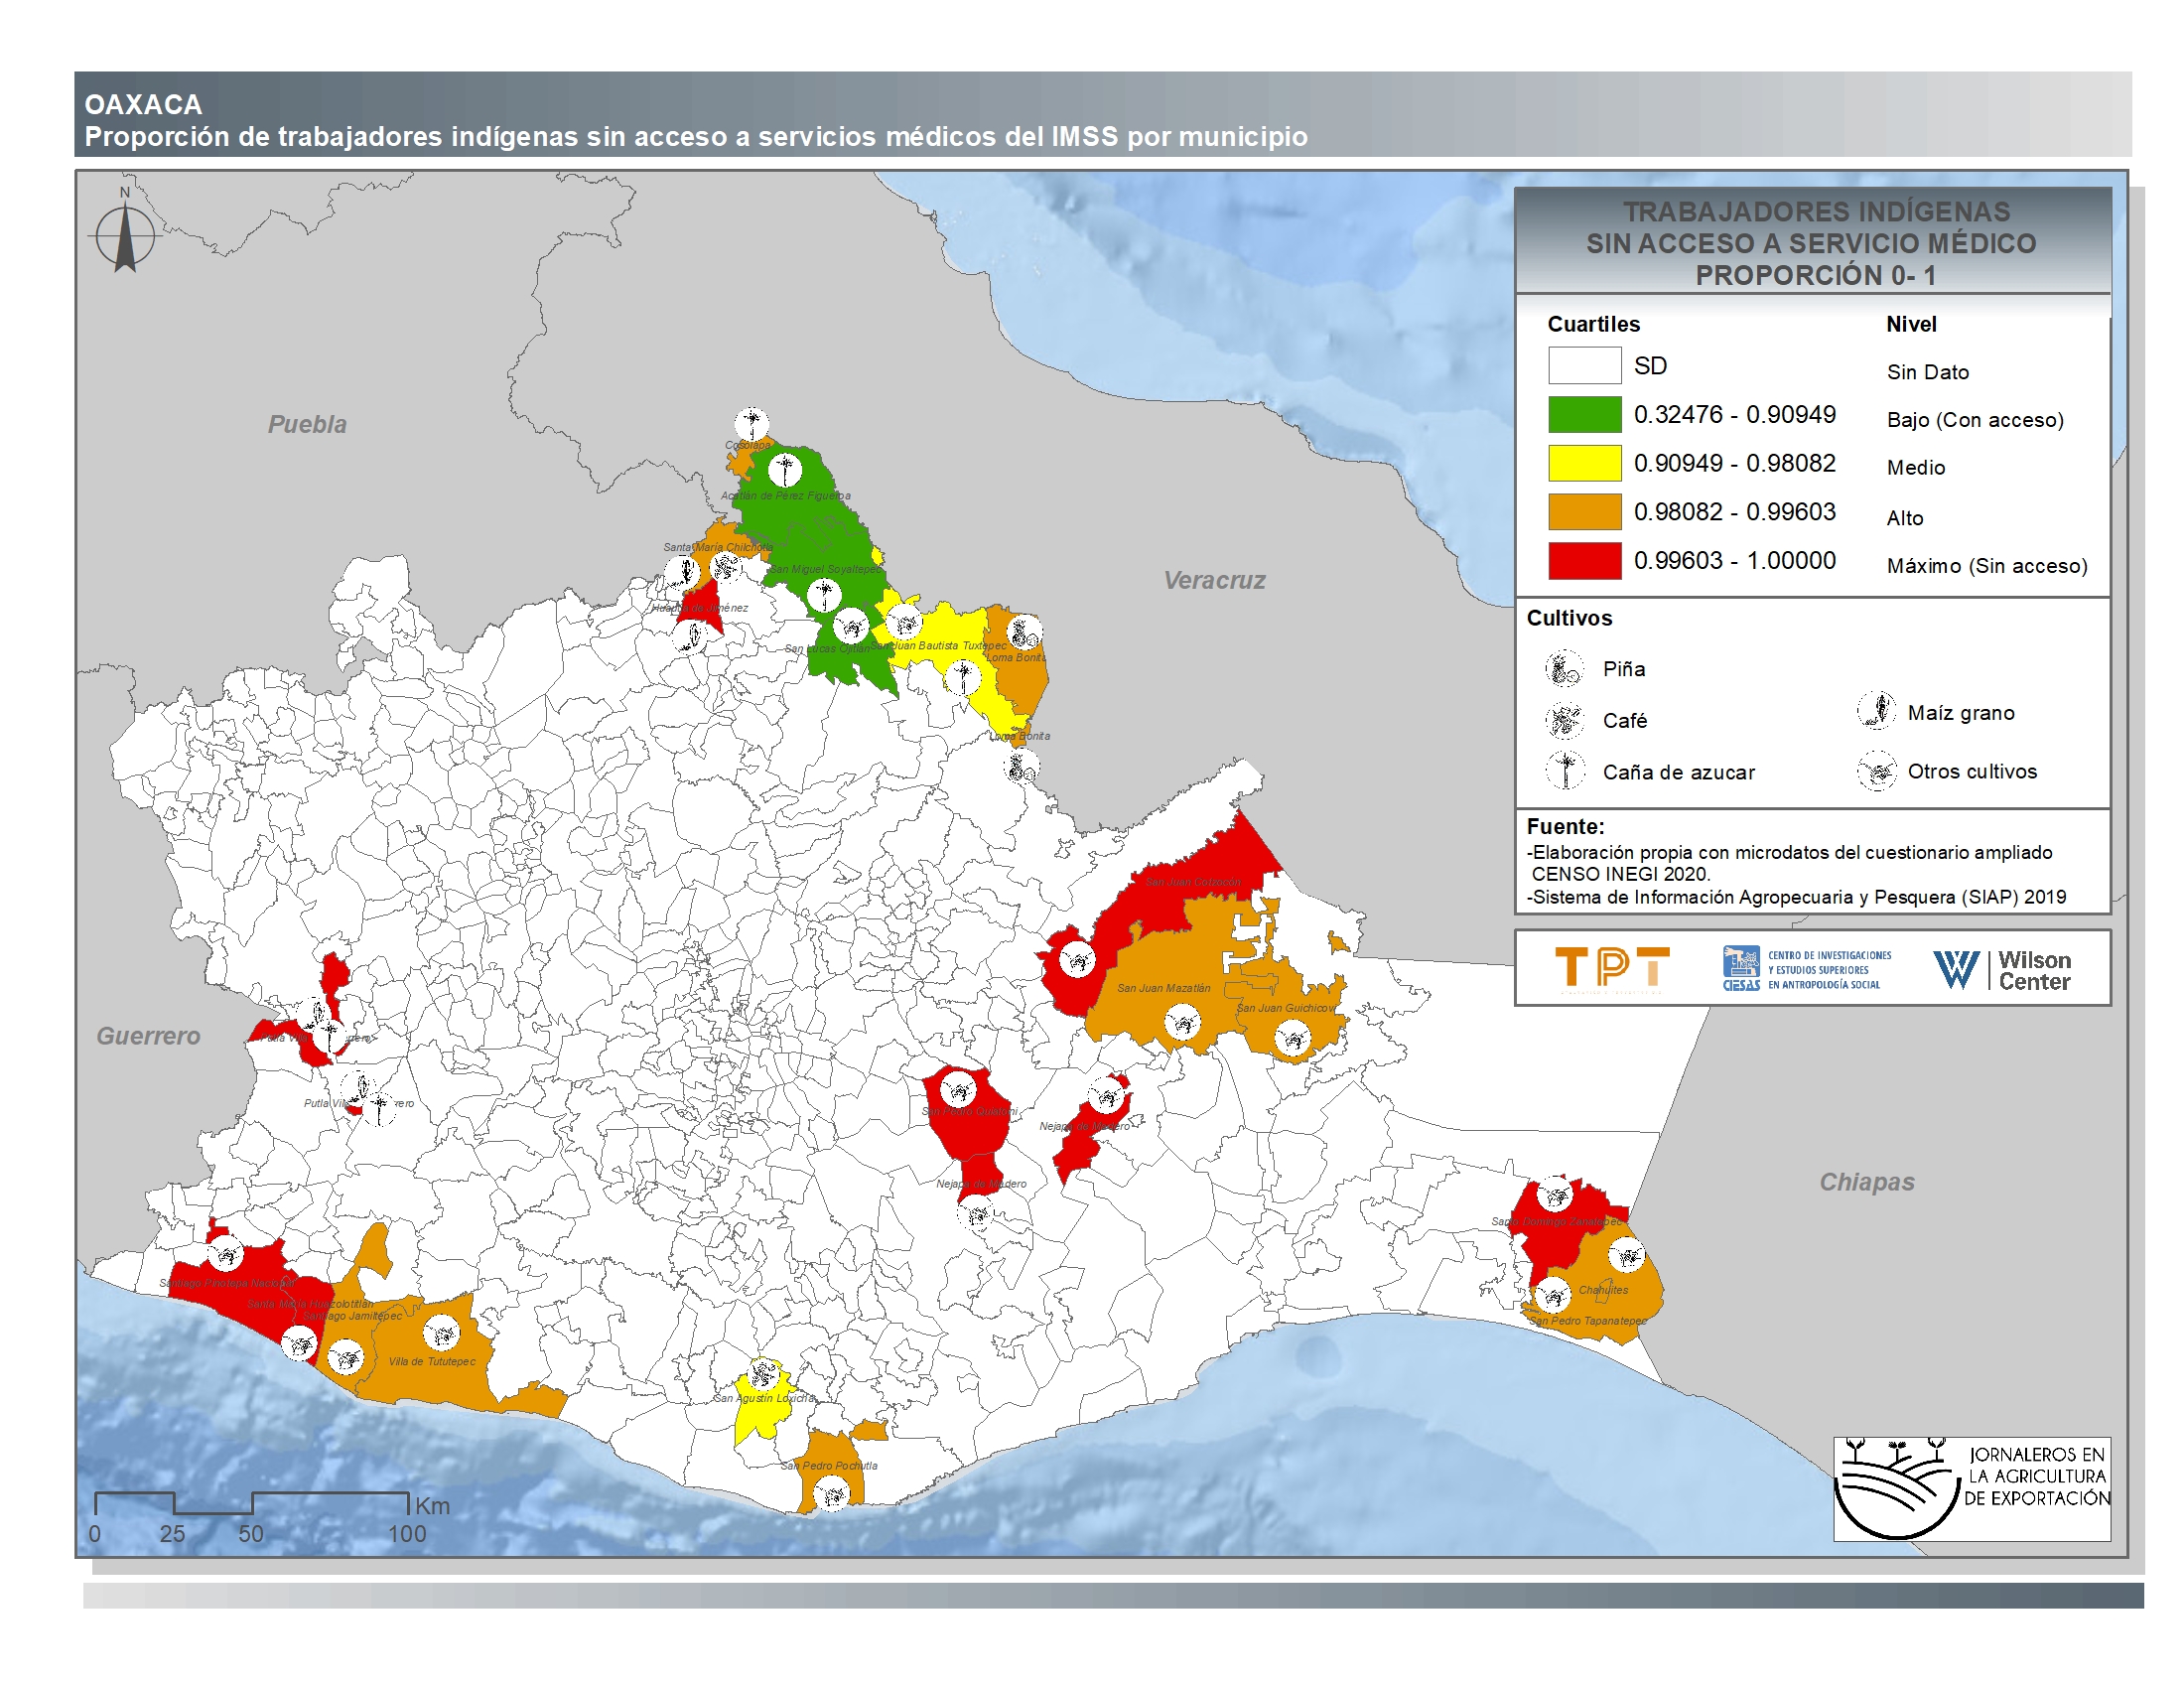
Oaxaca
-
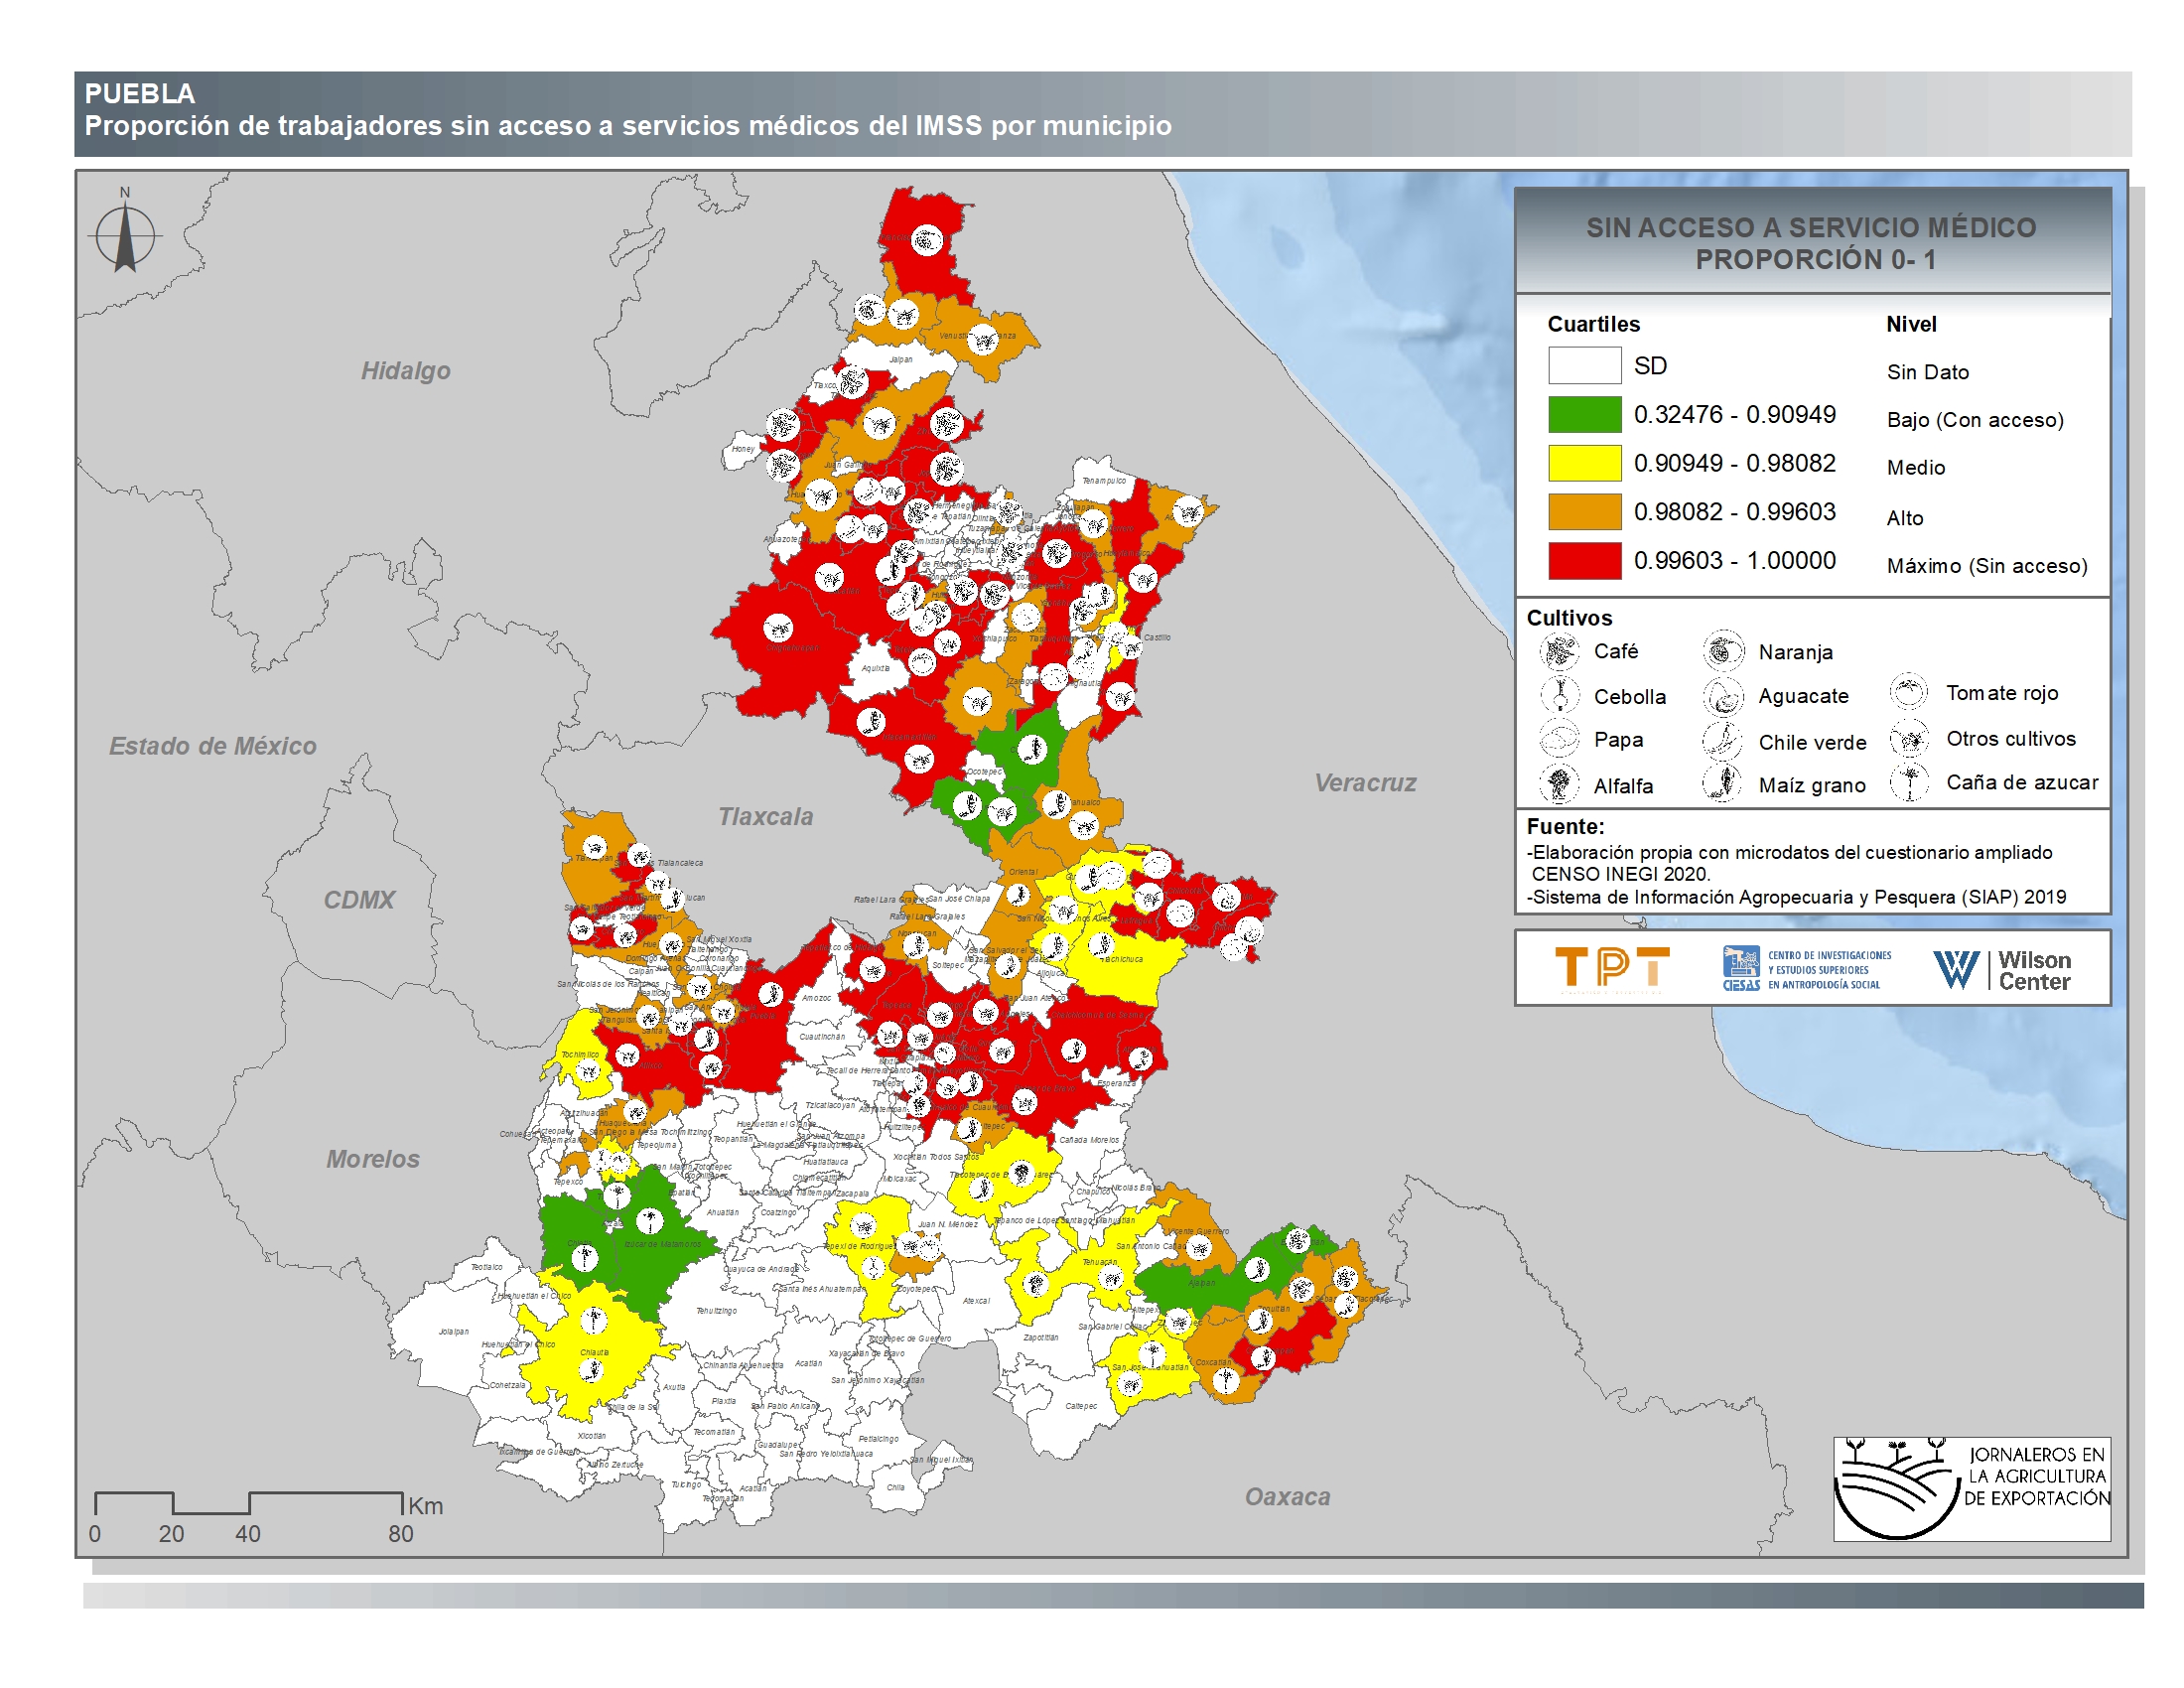
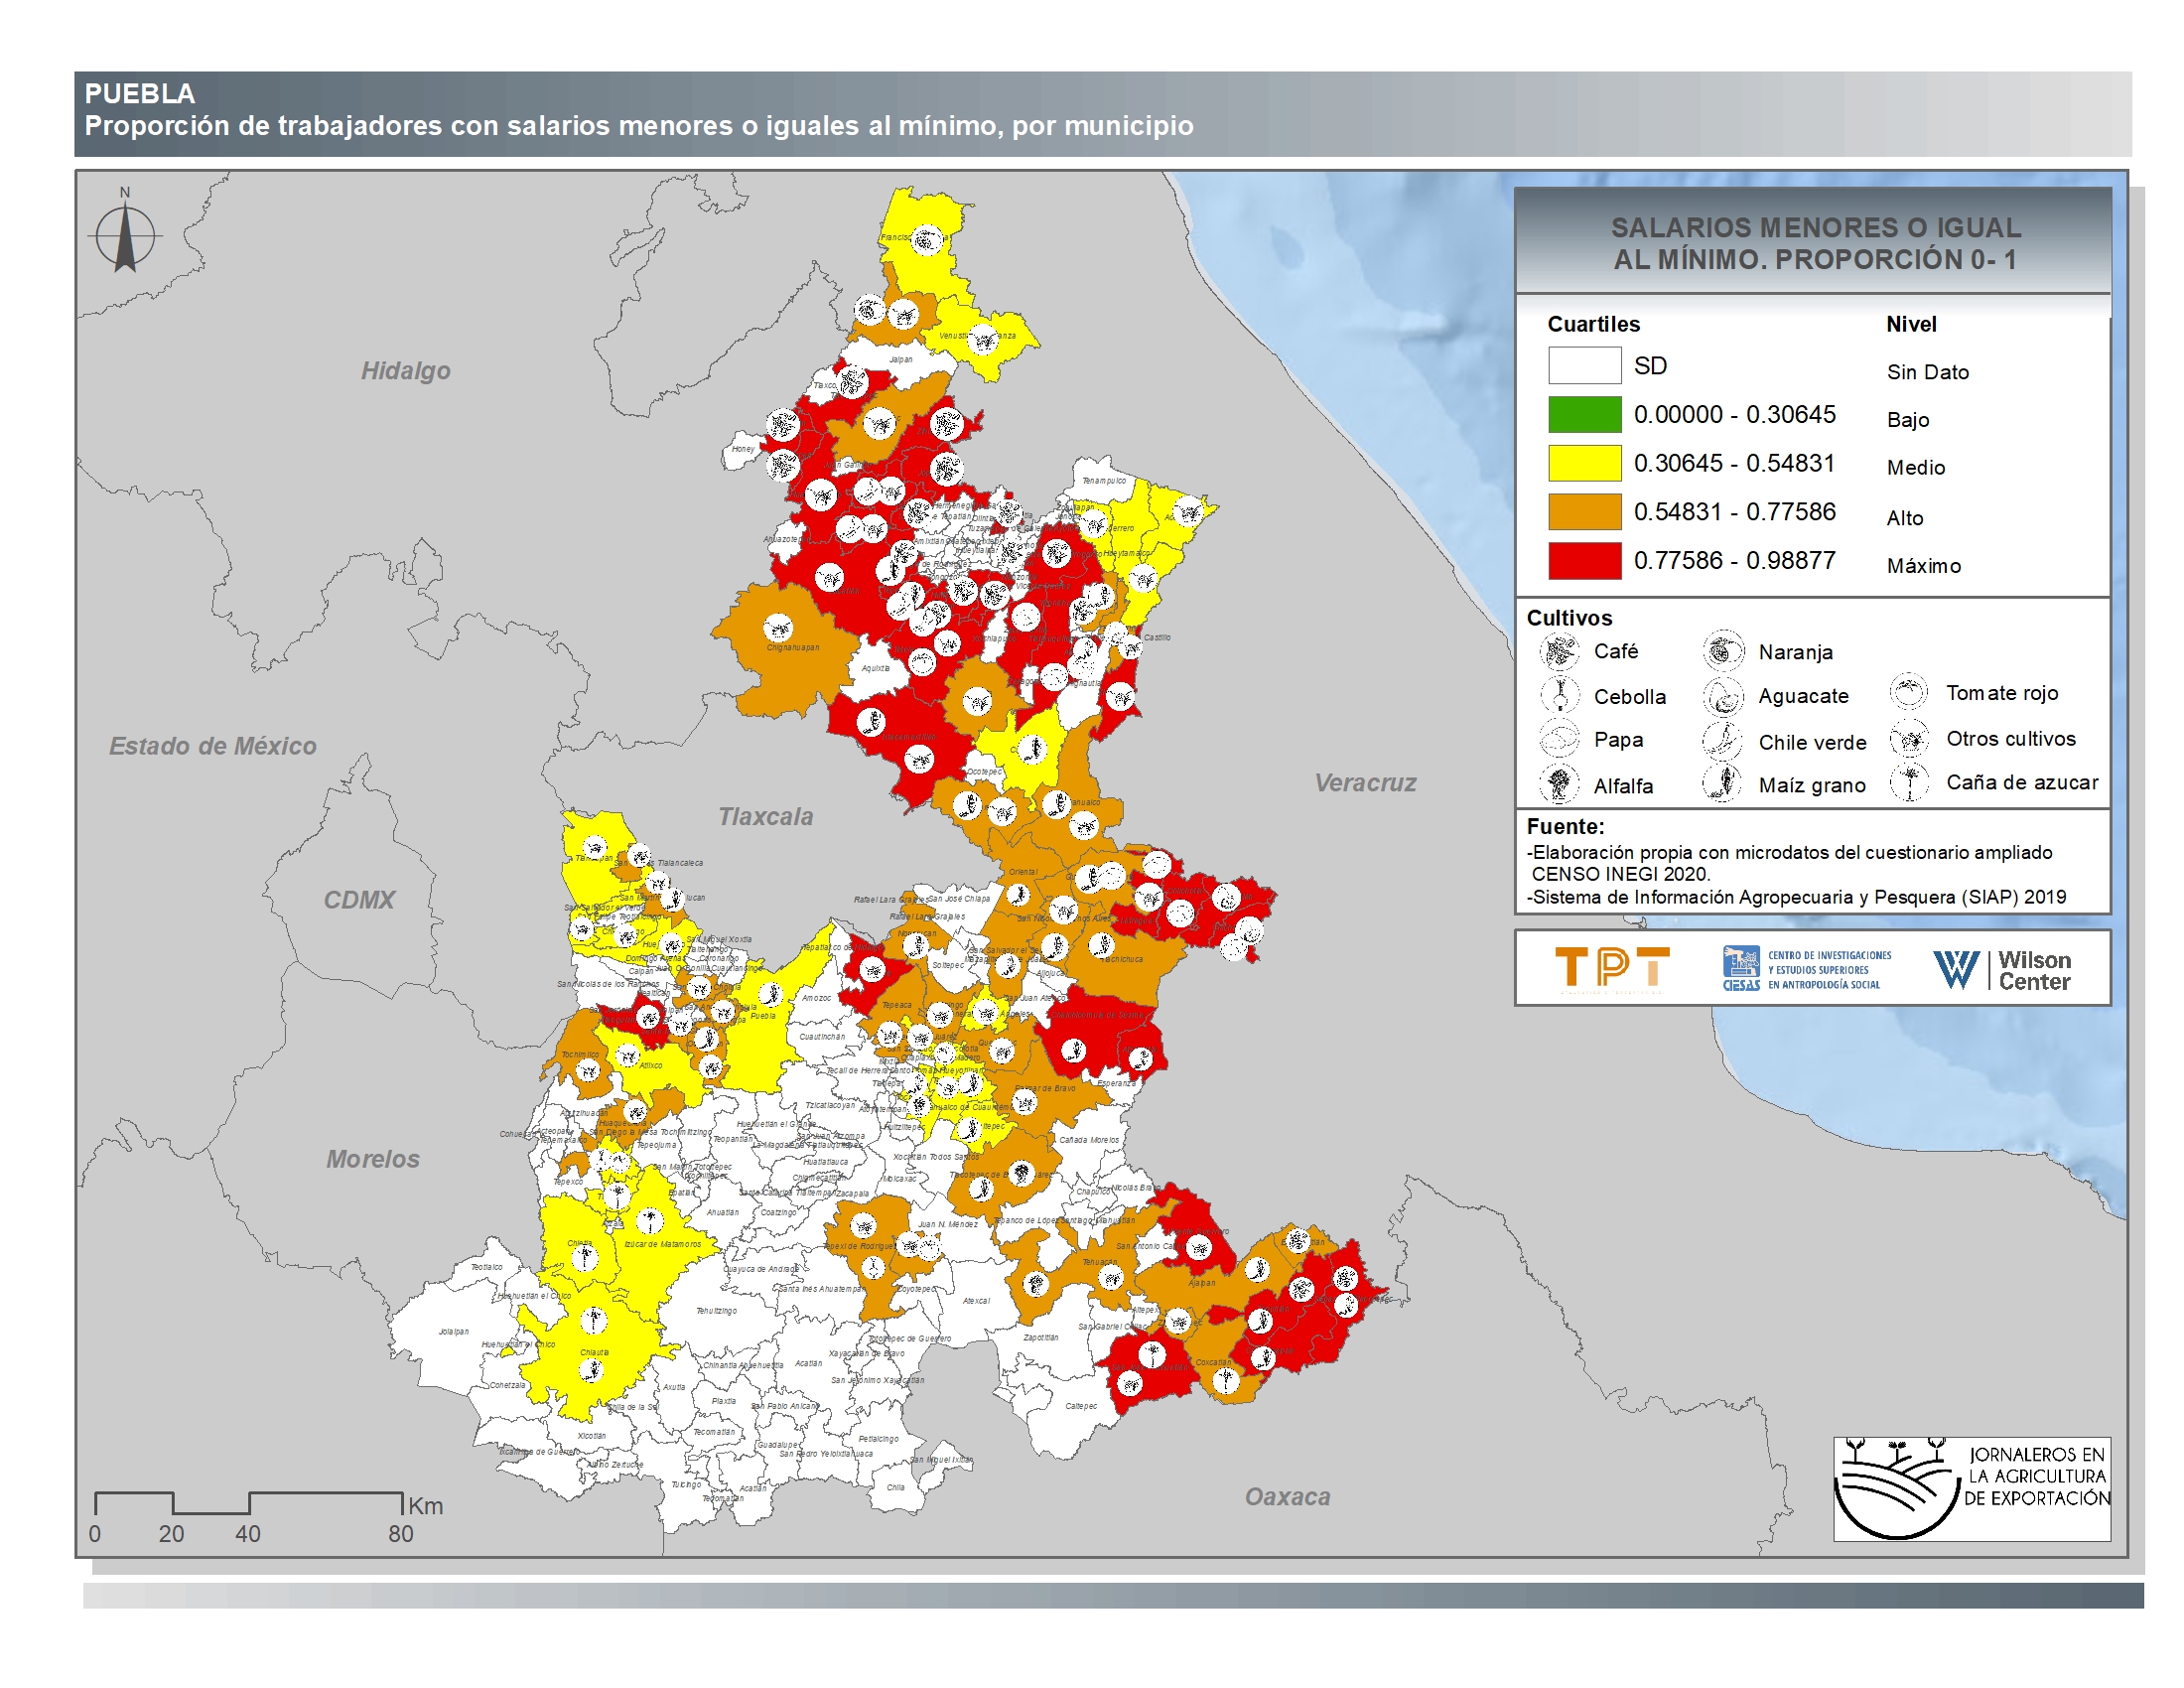
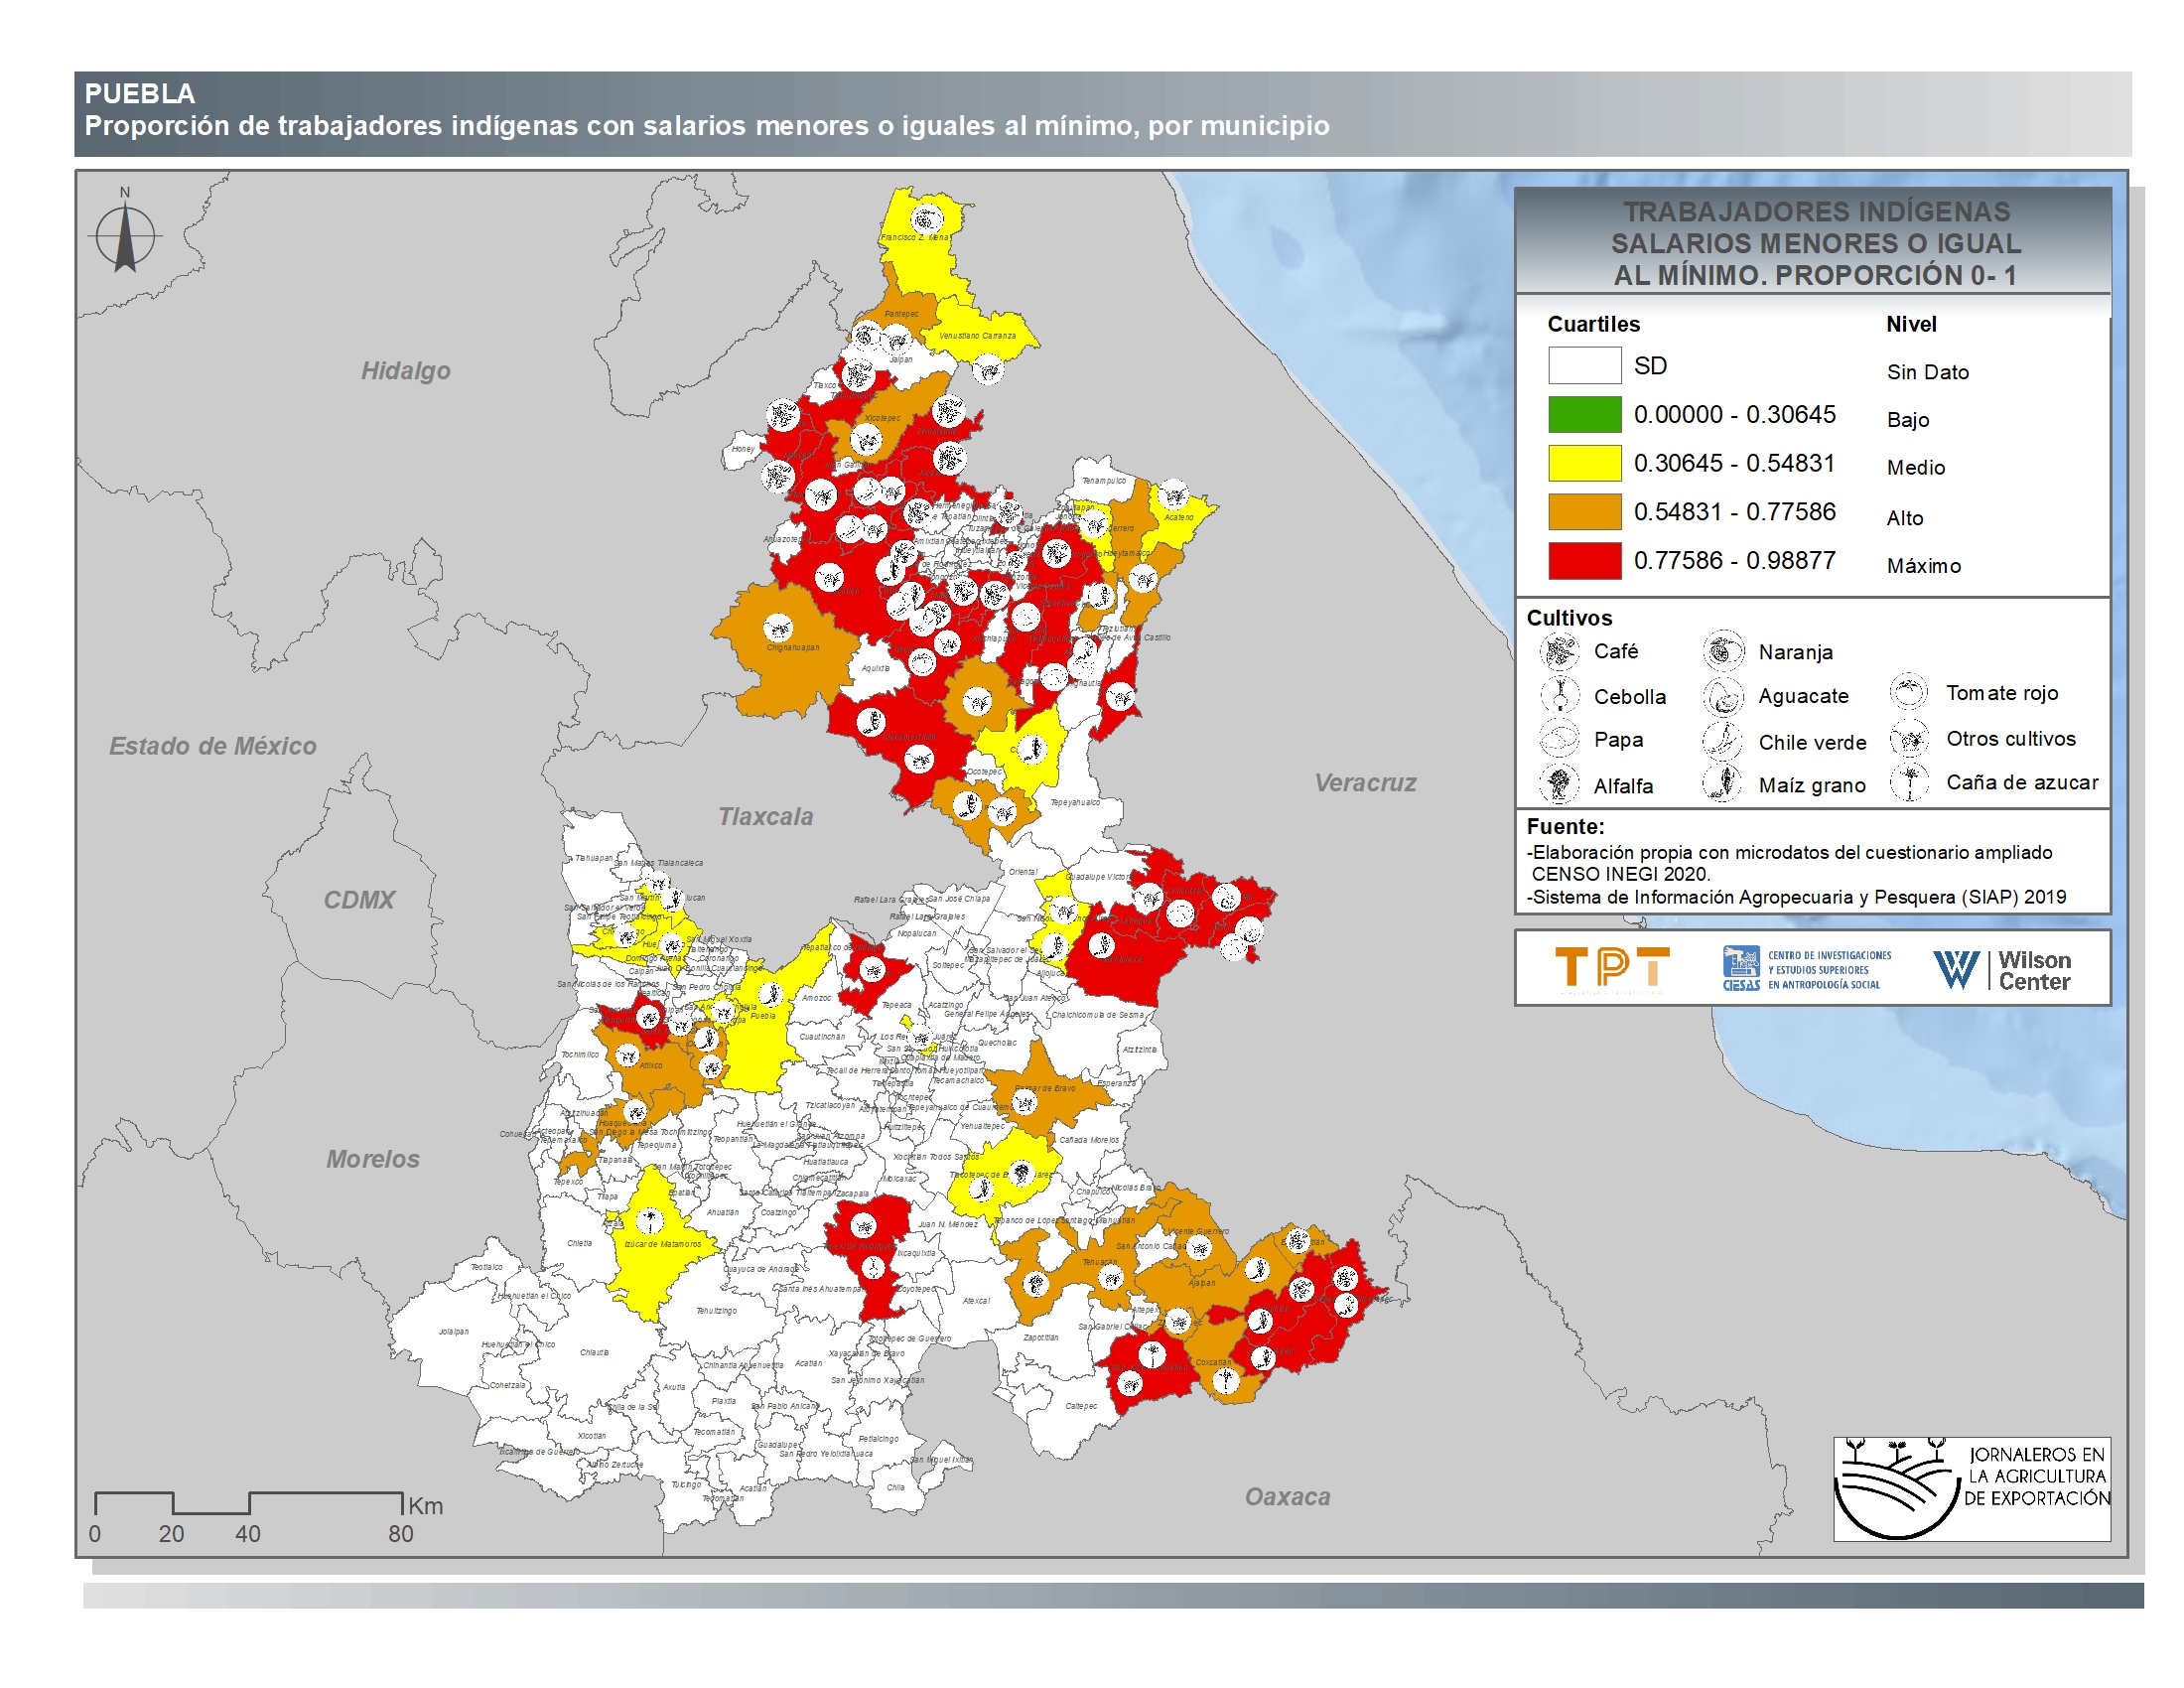
Puebla
-
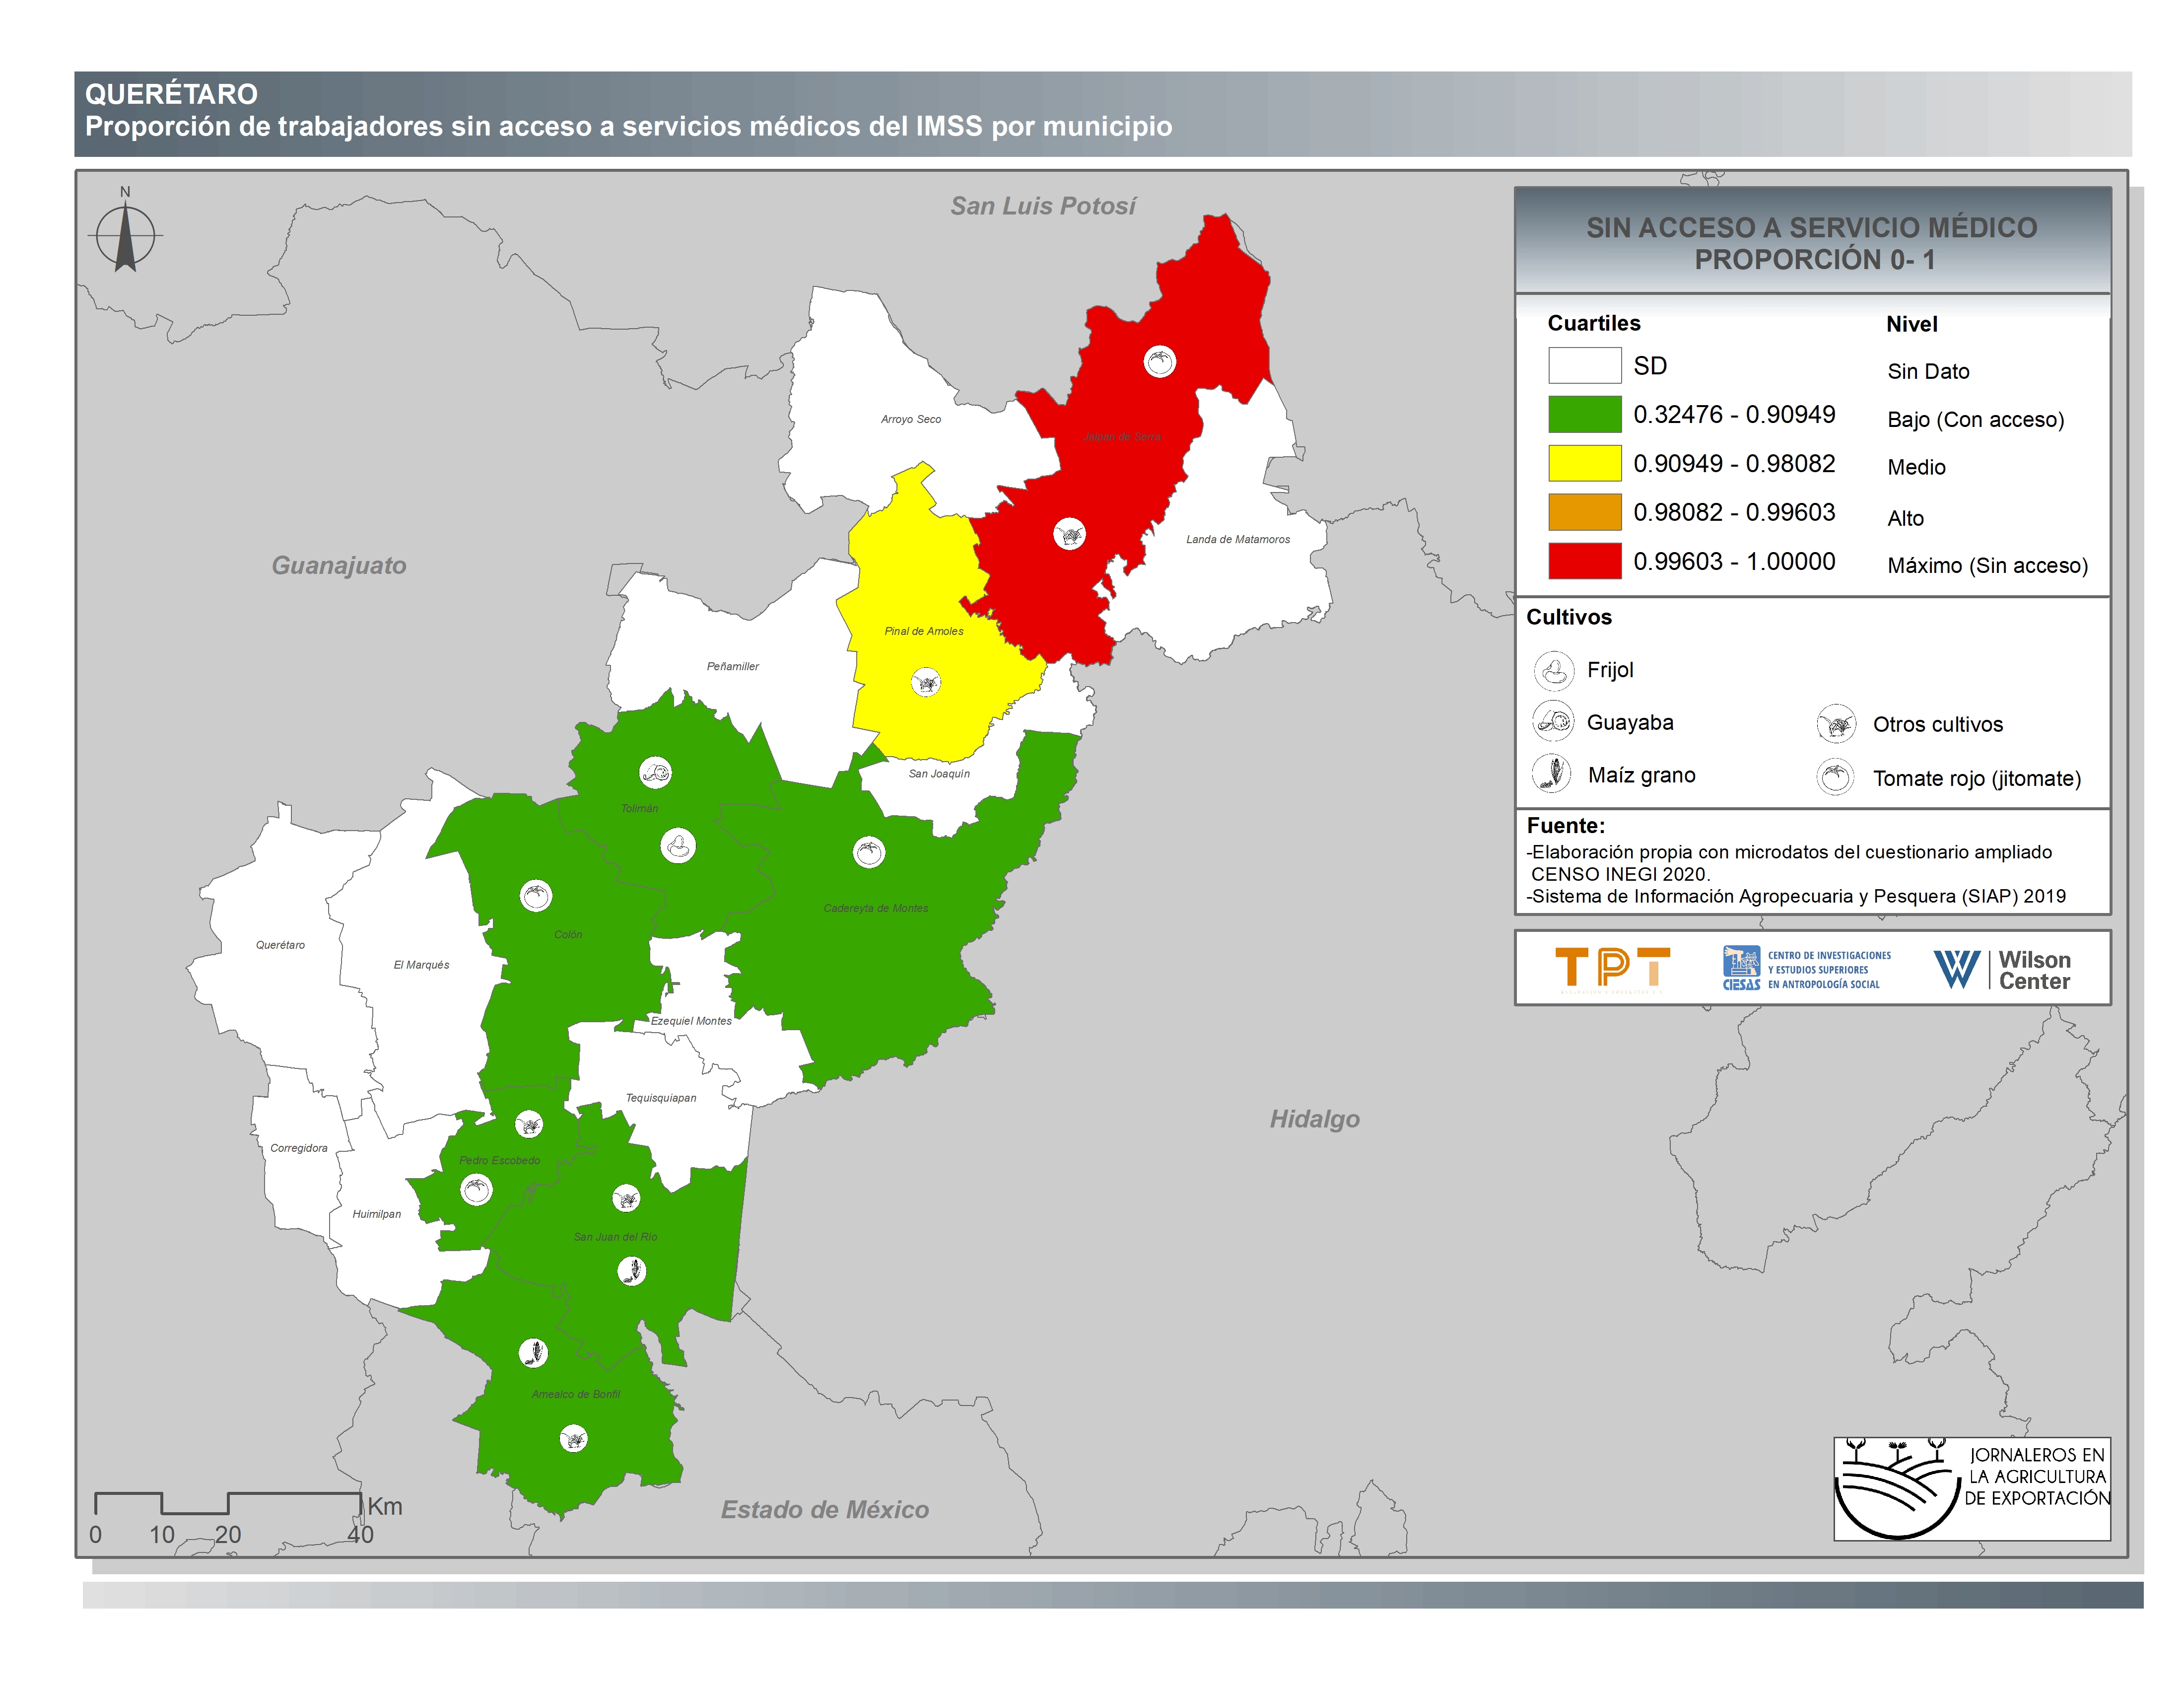
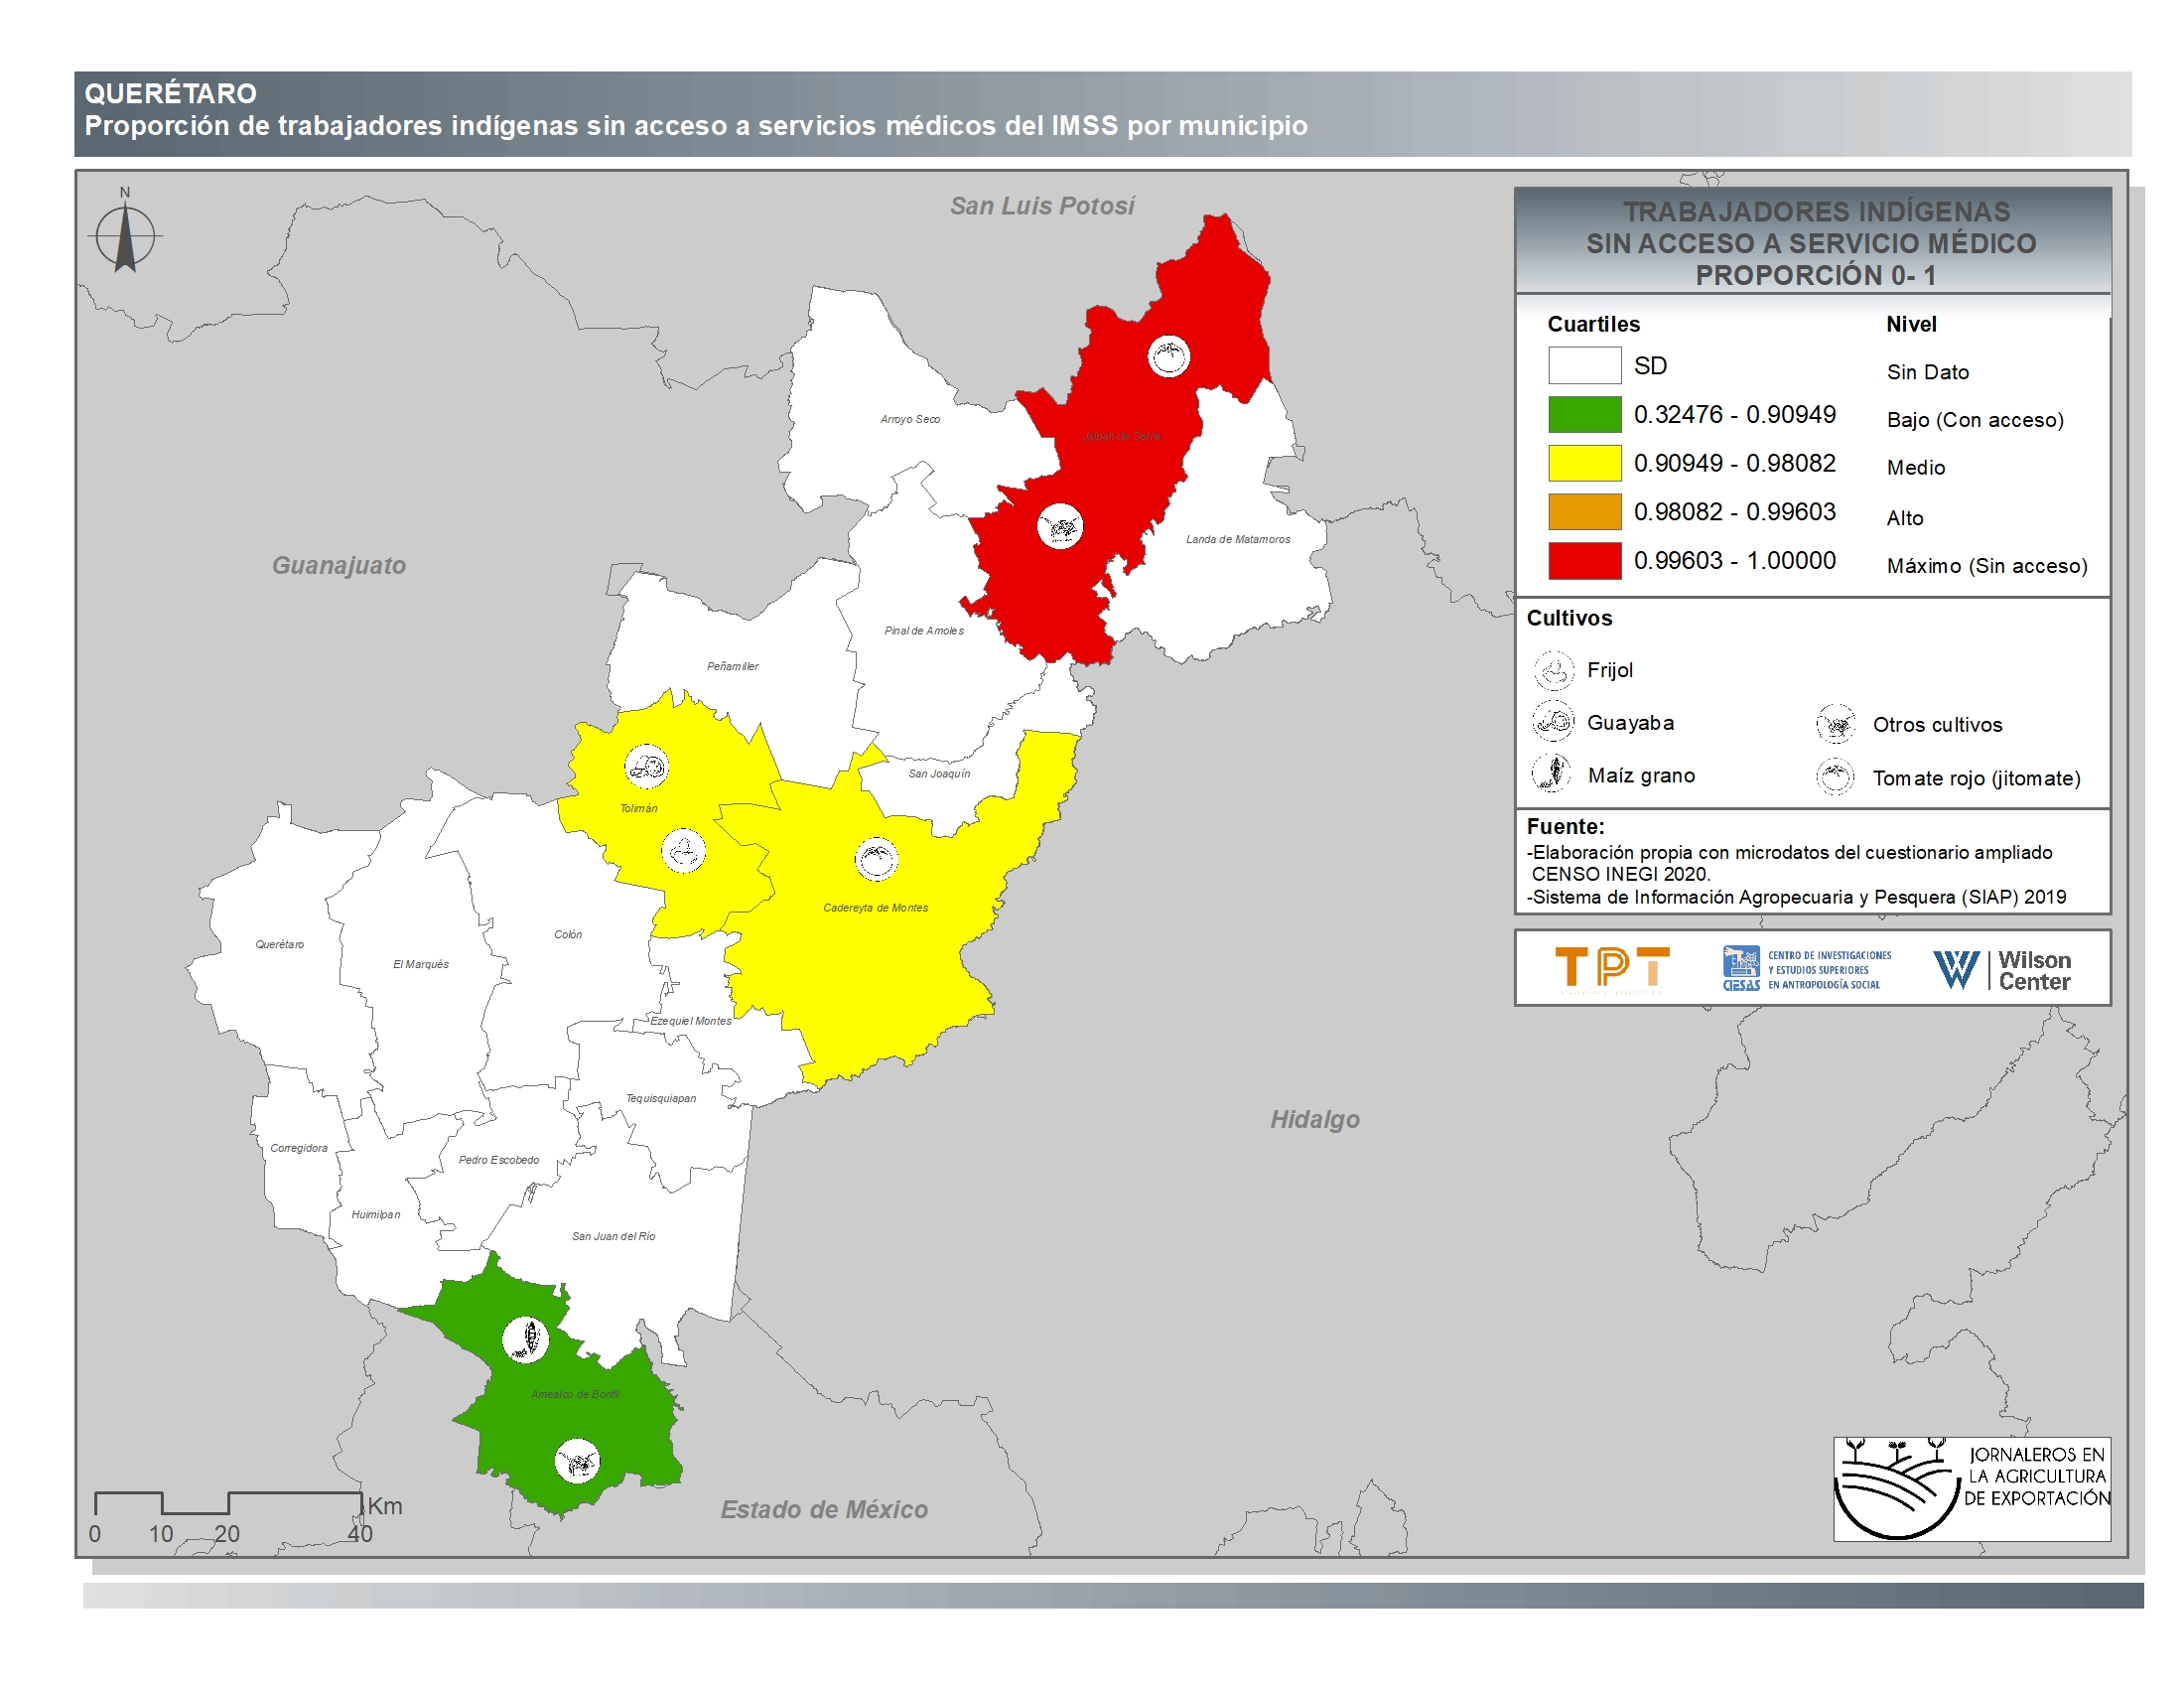
Querétaro
-
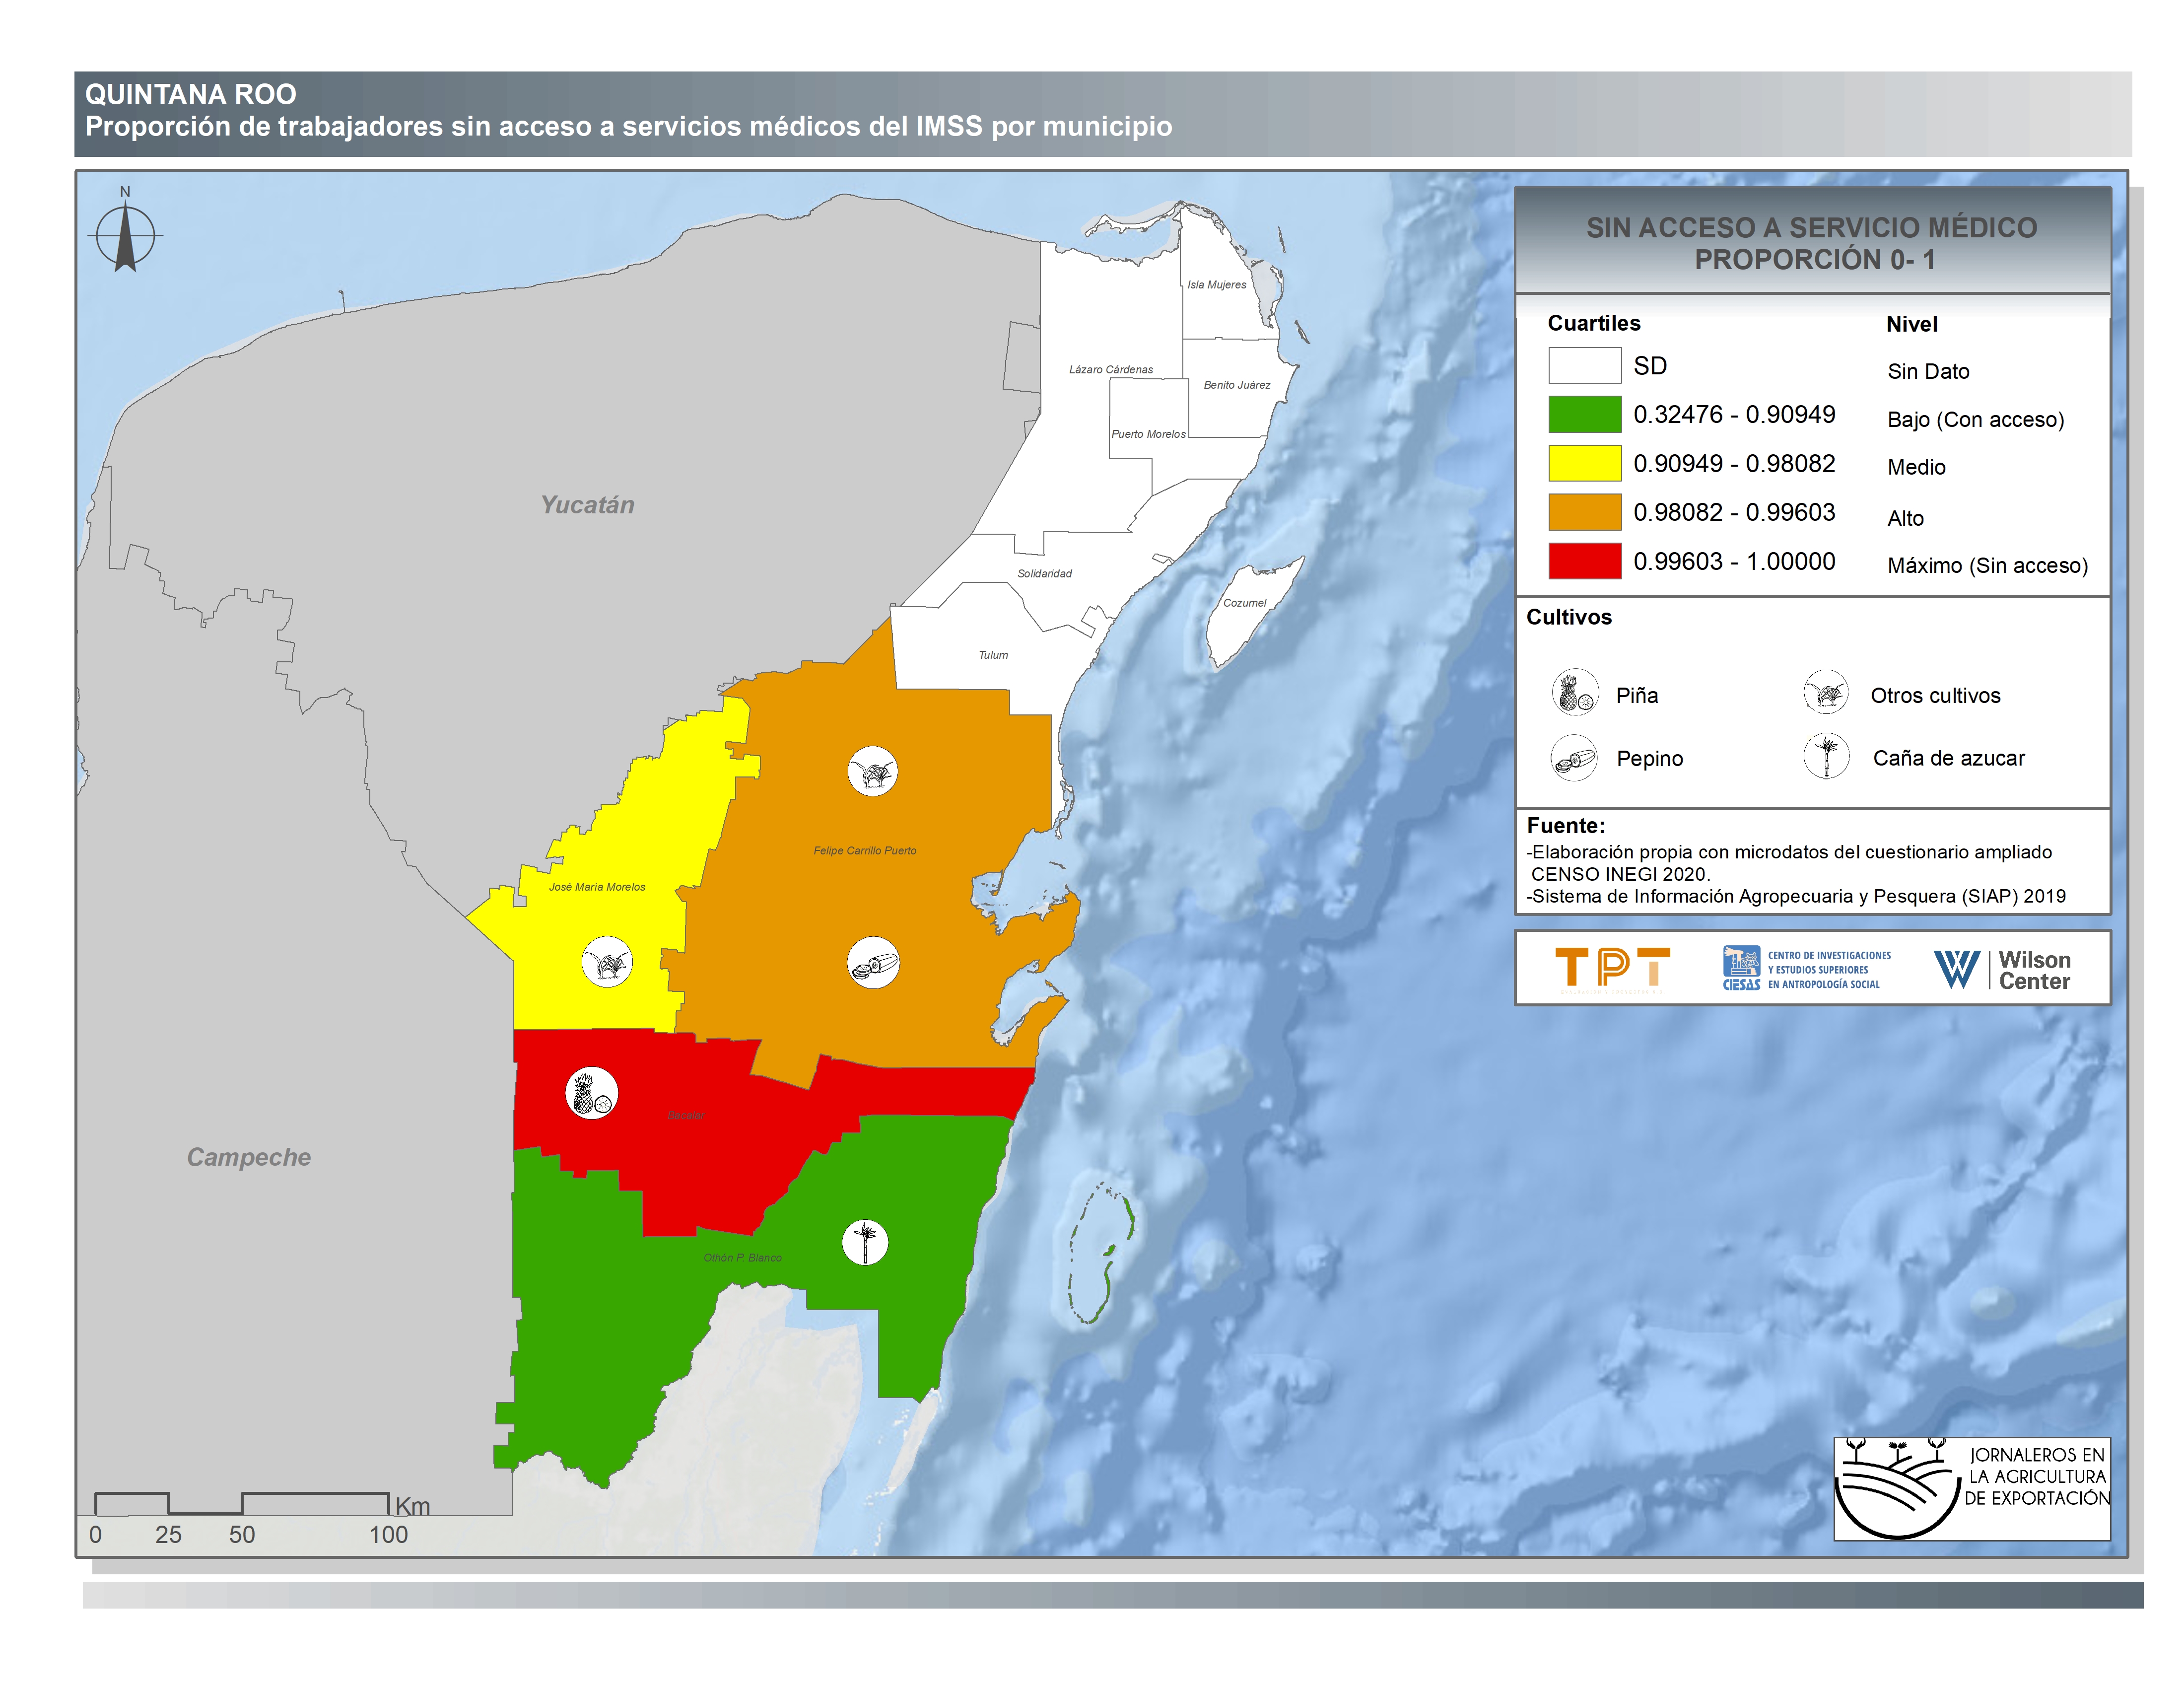
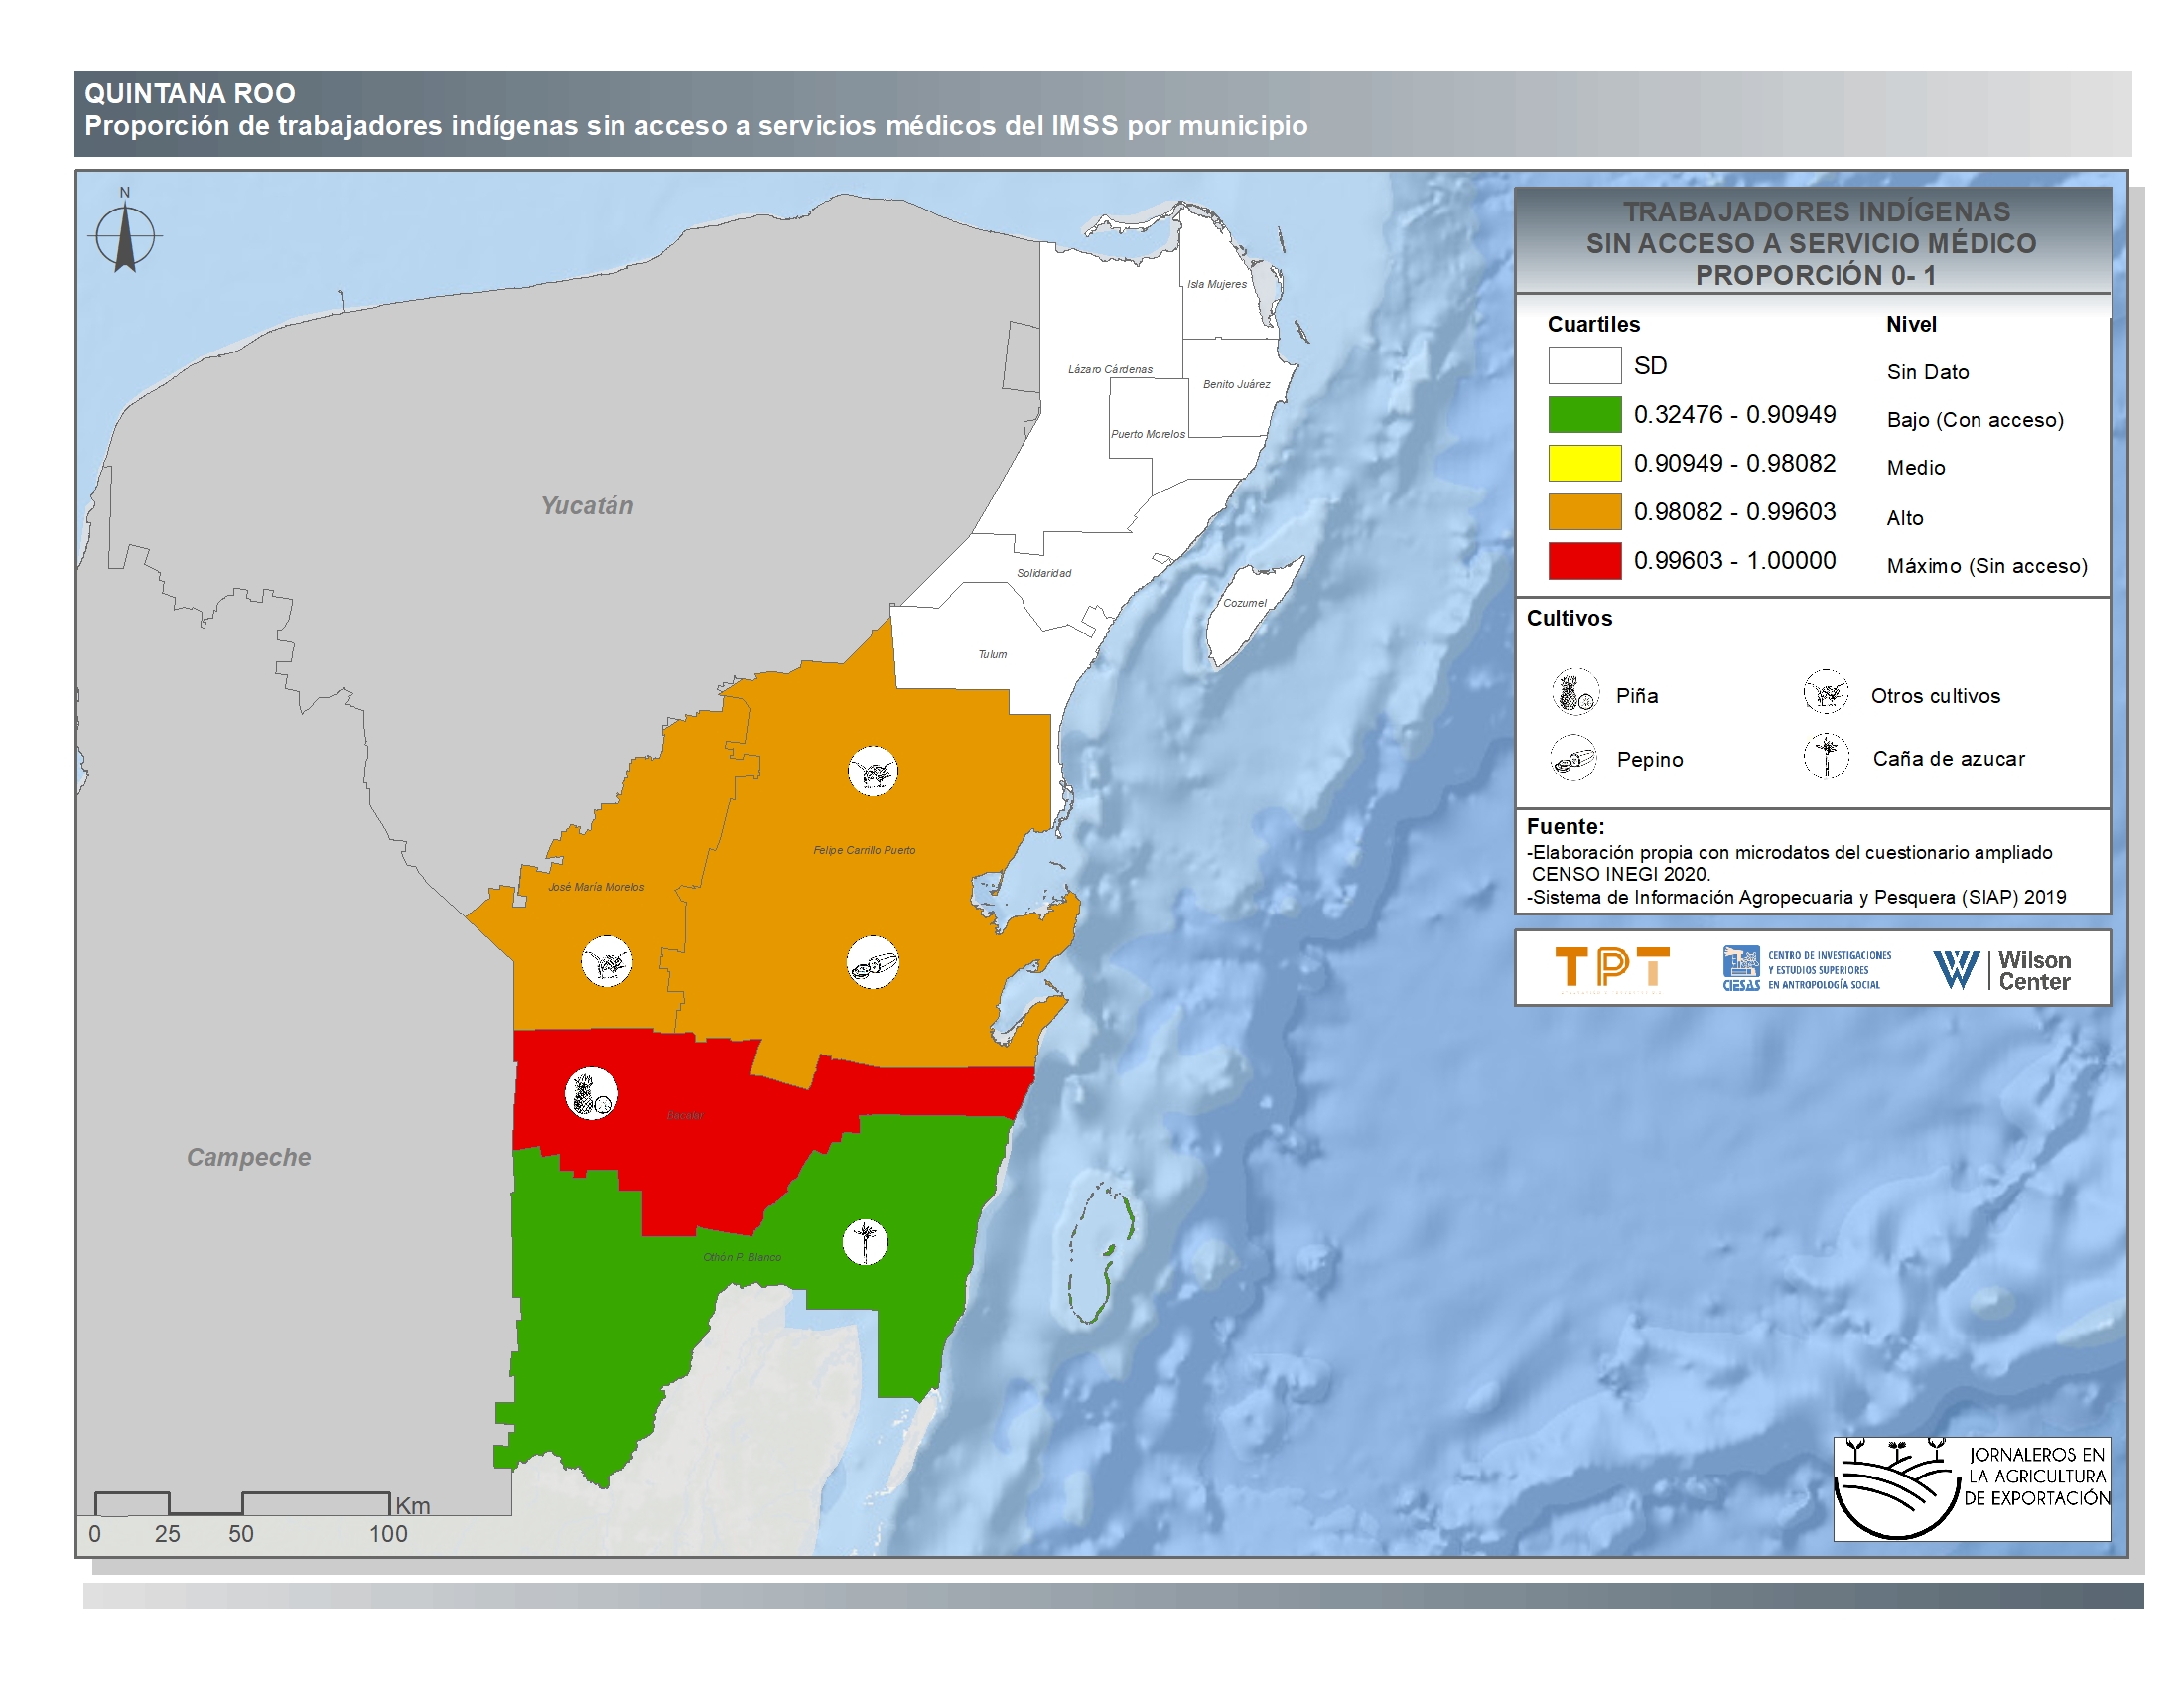
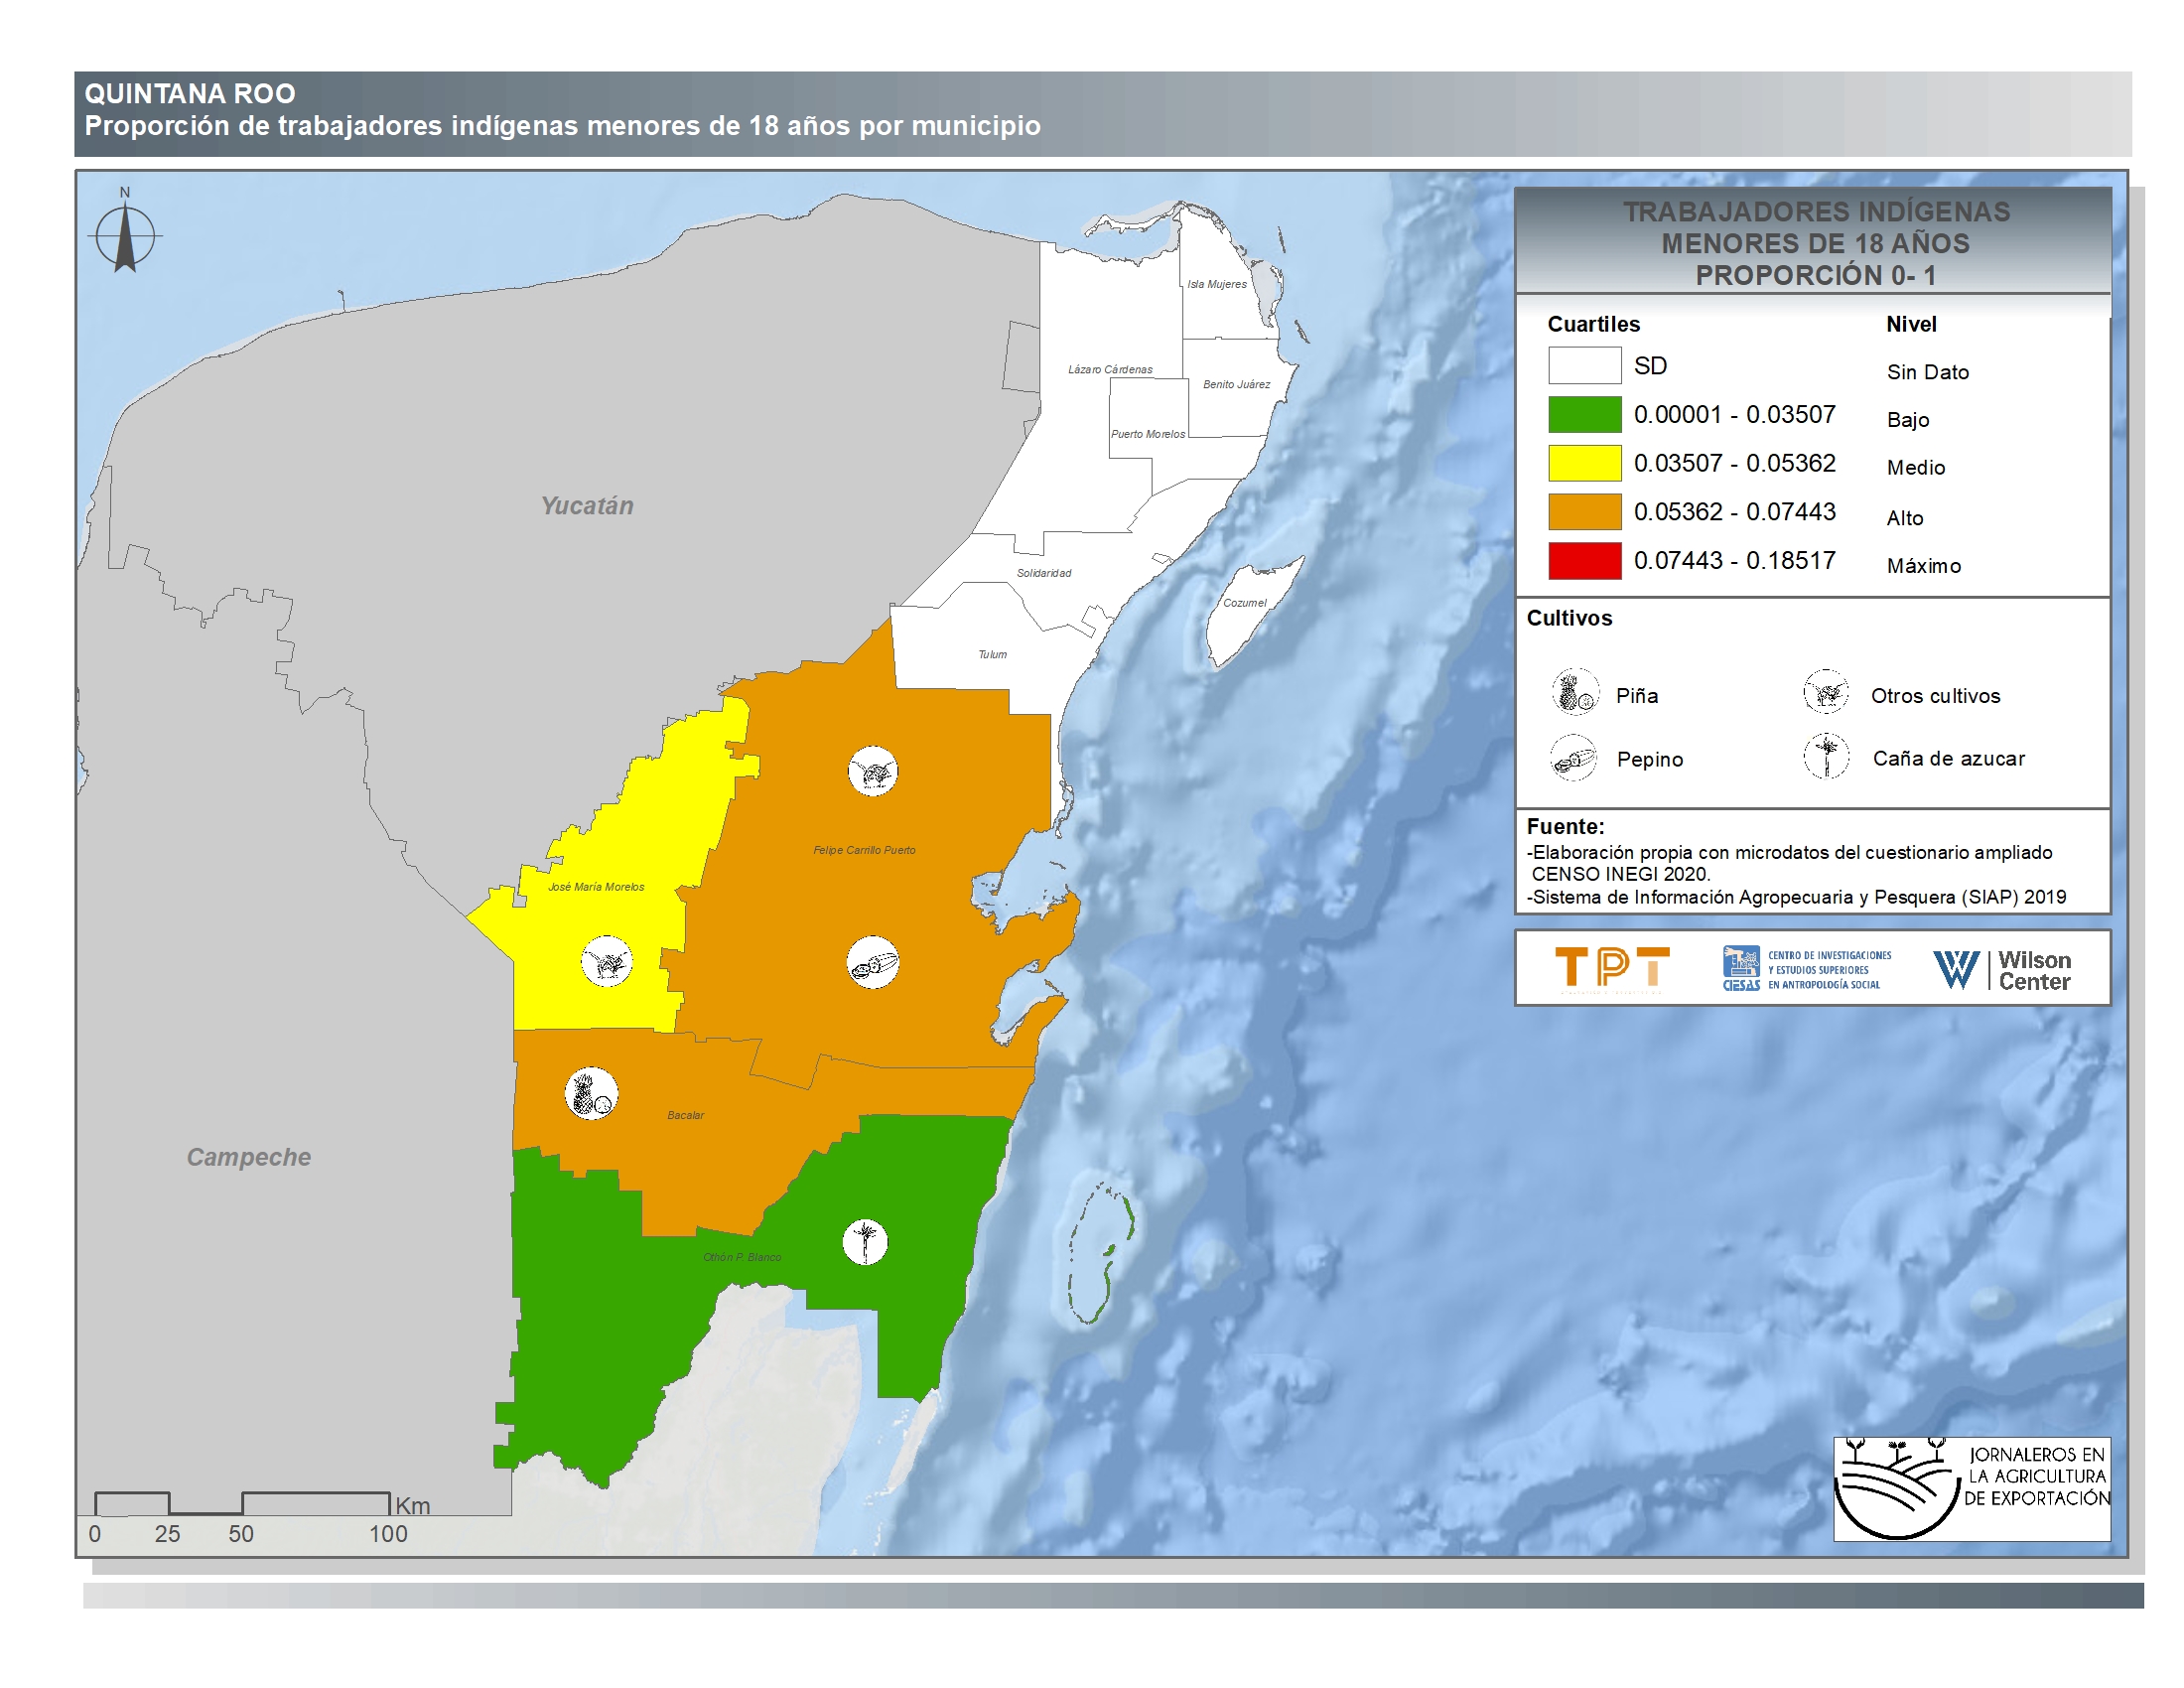
Quintana Roo
-
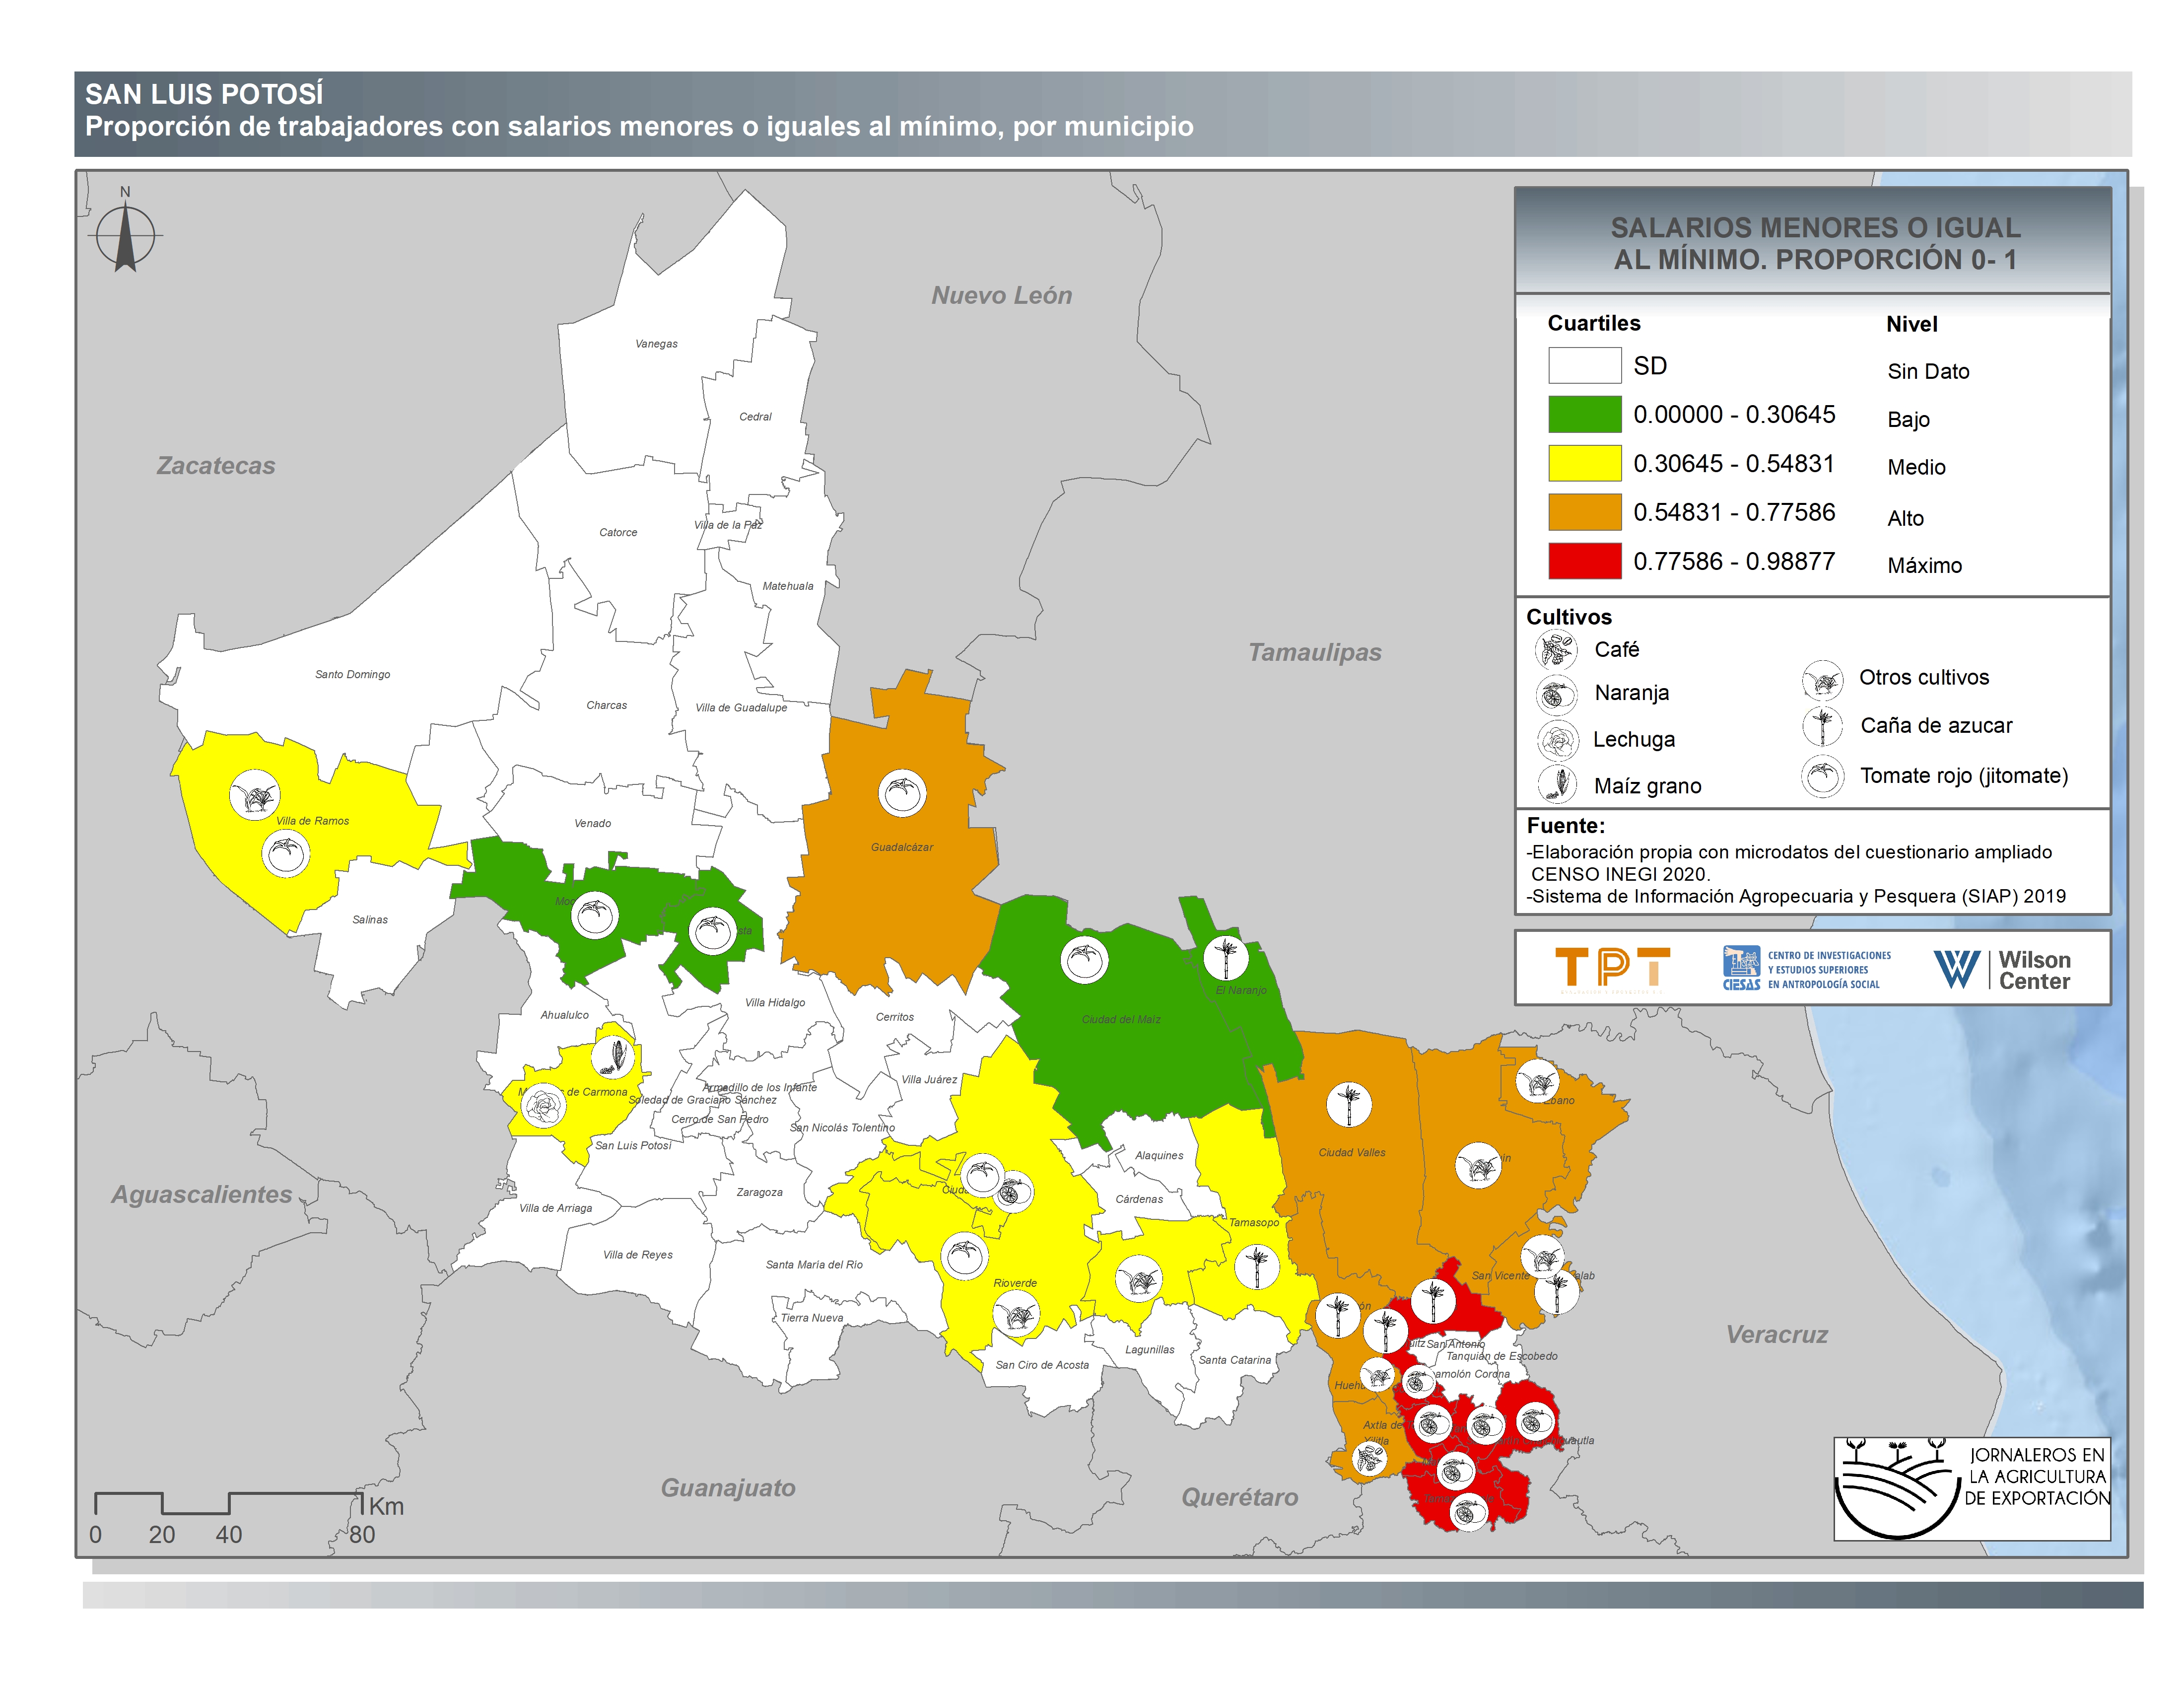
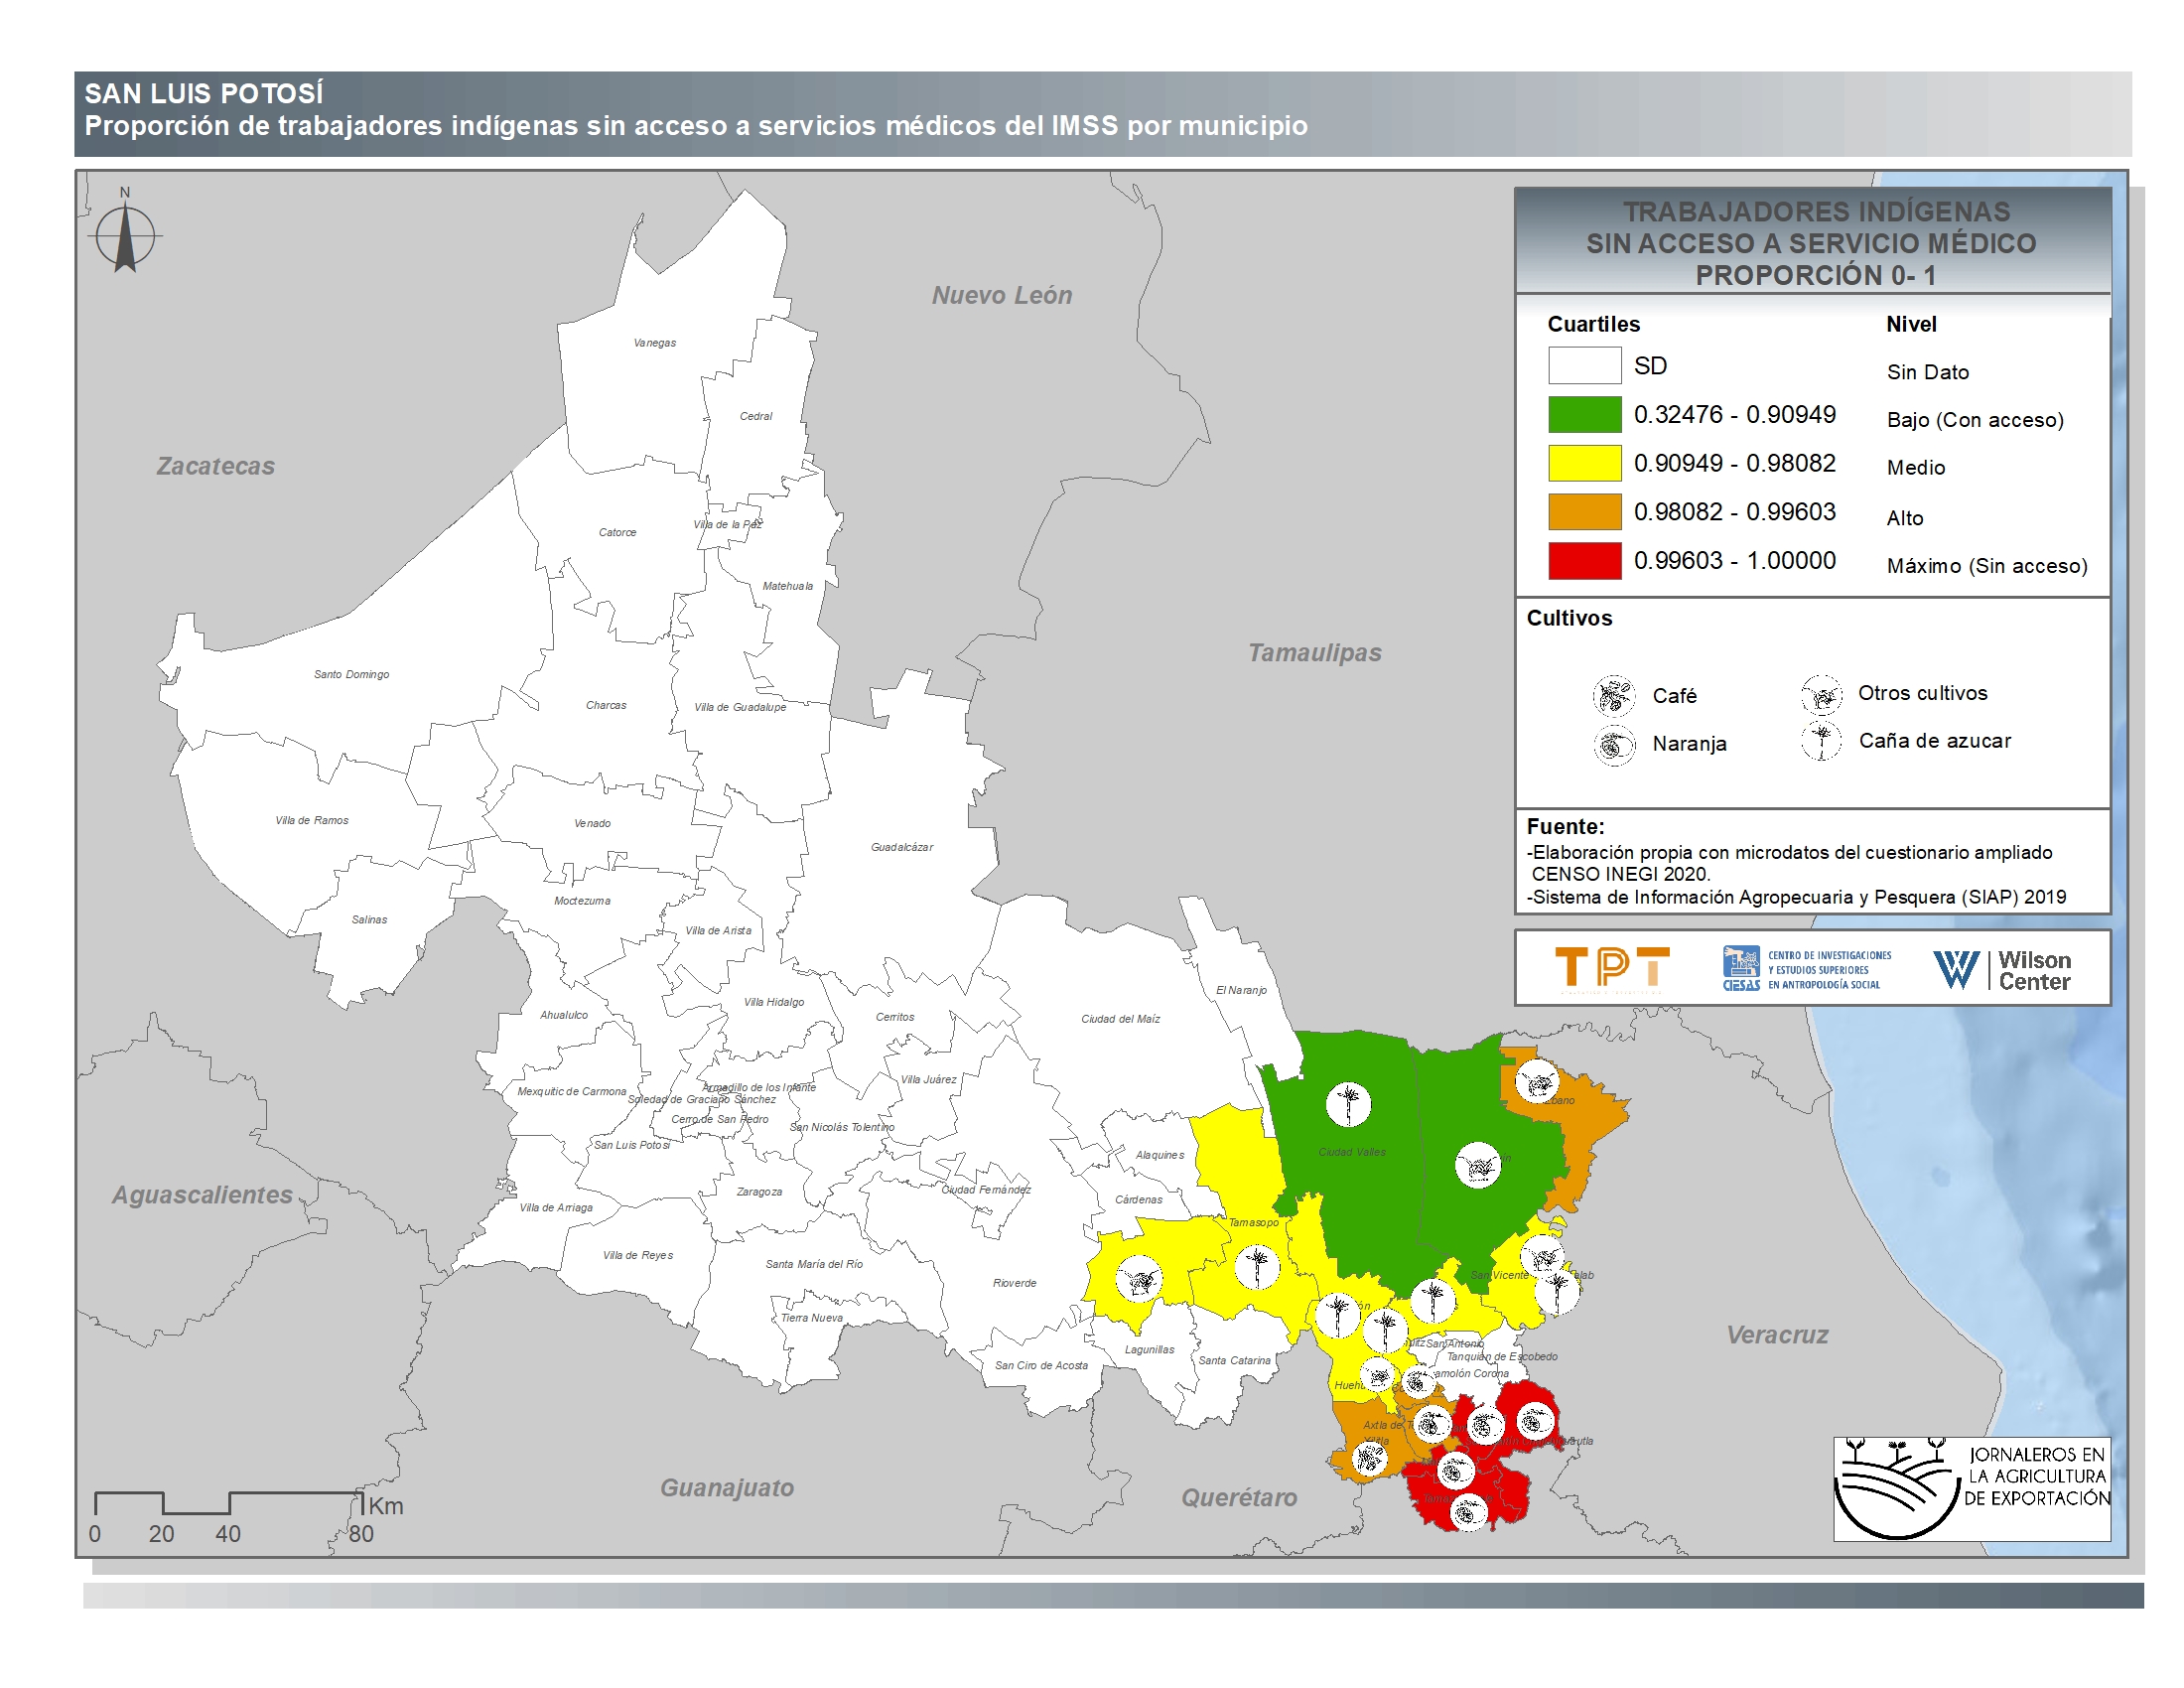
San Luis Potosí
-
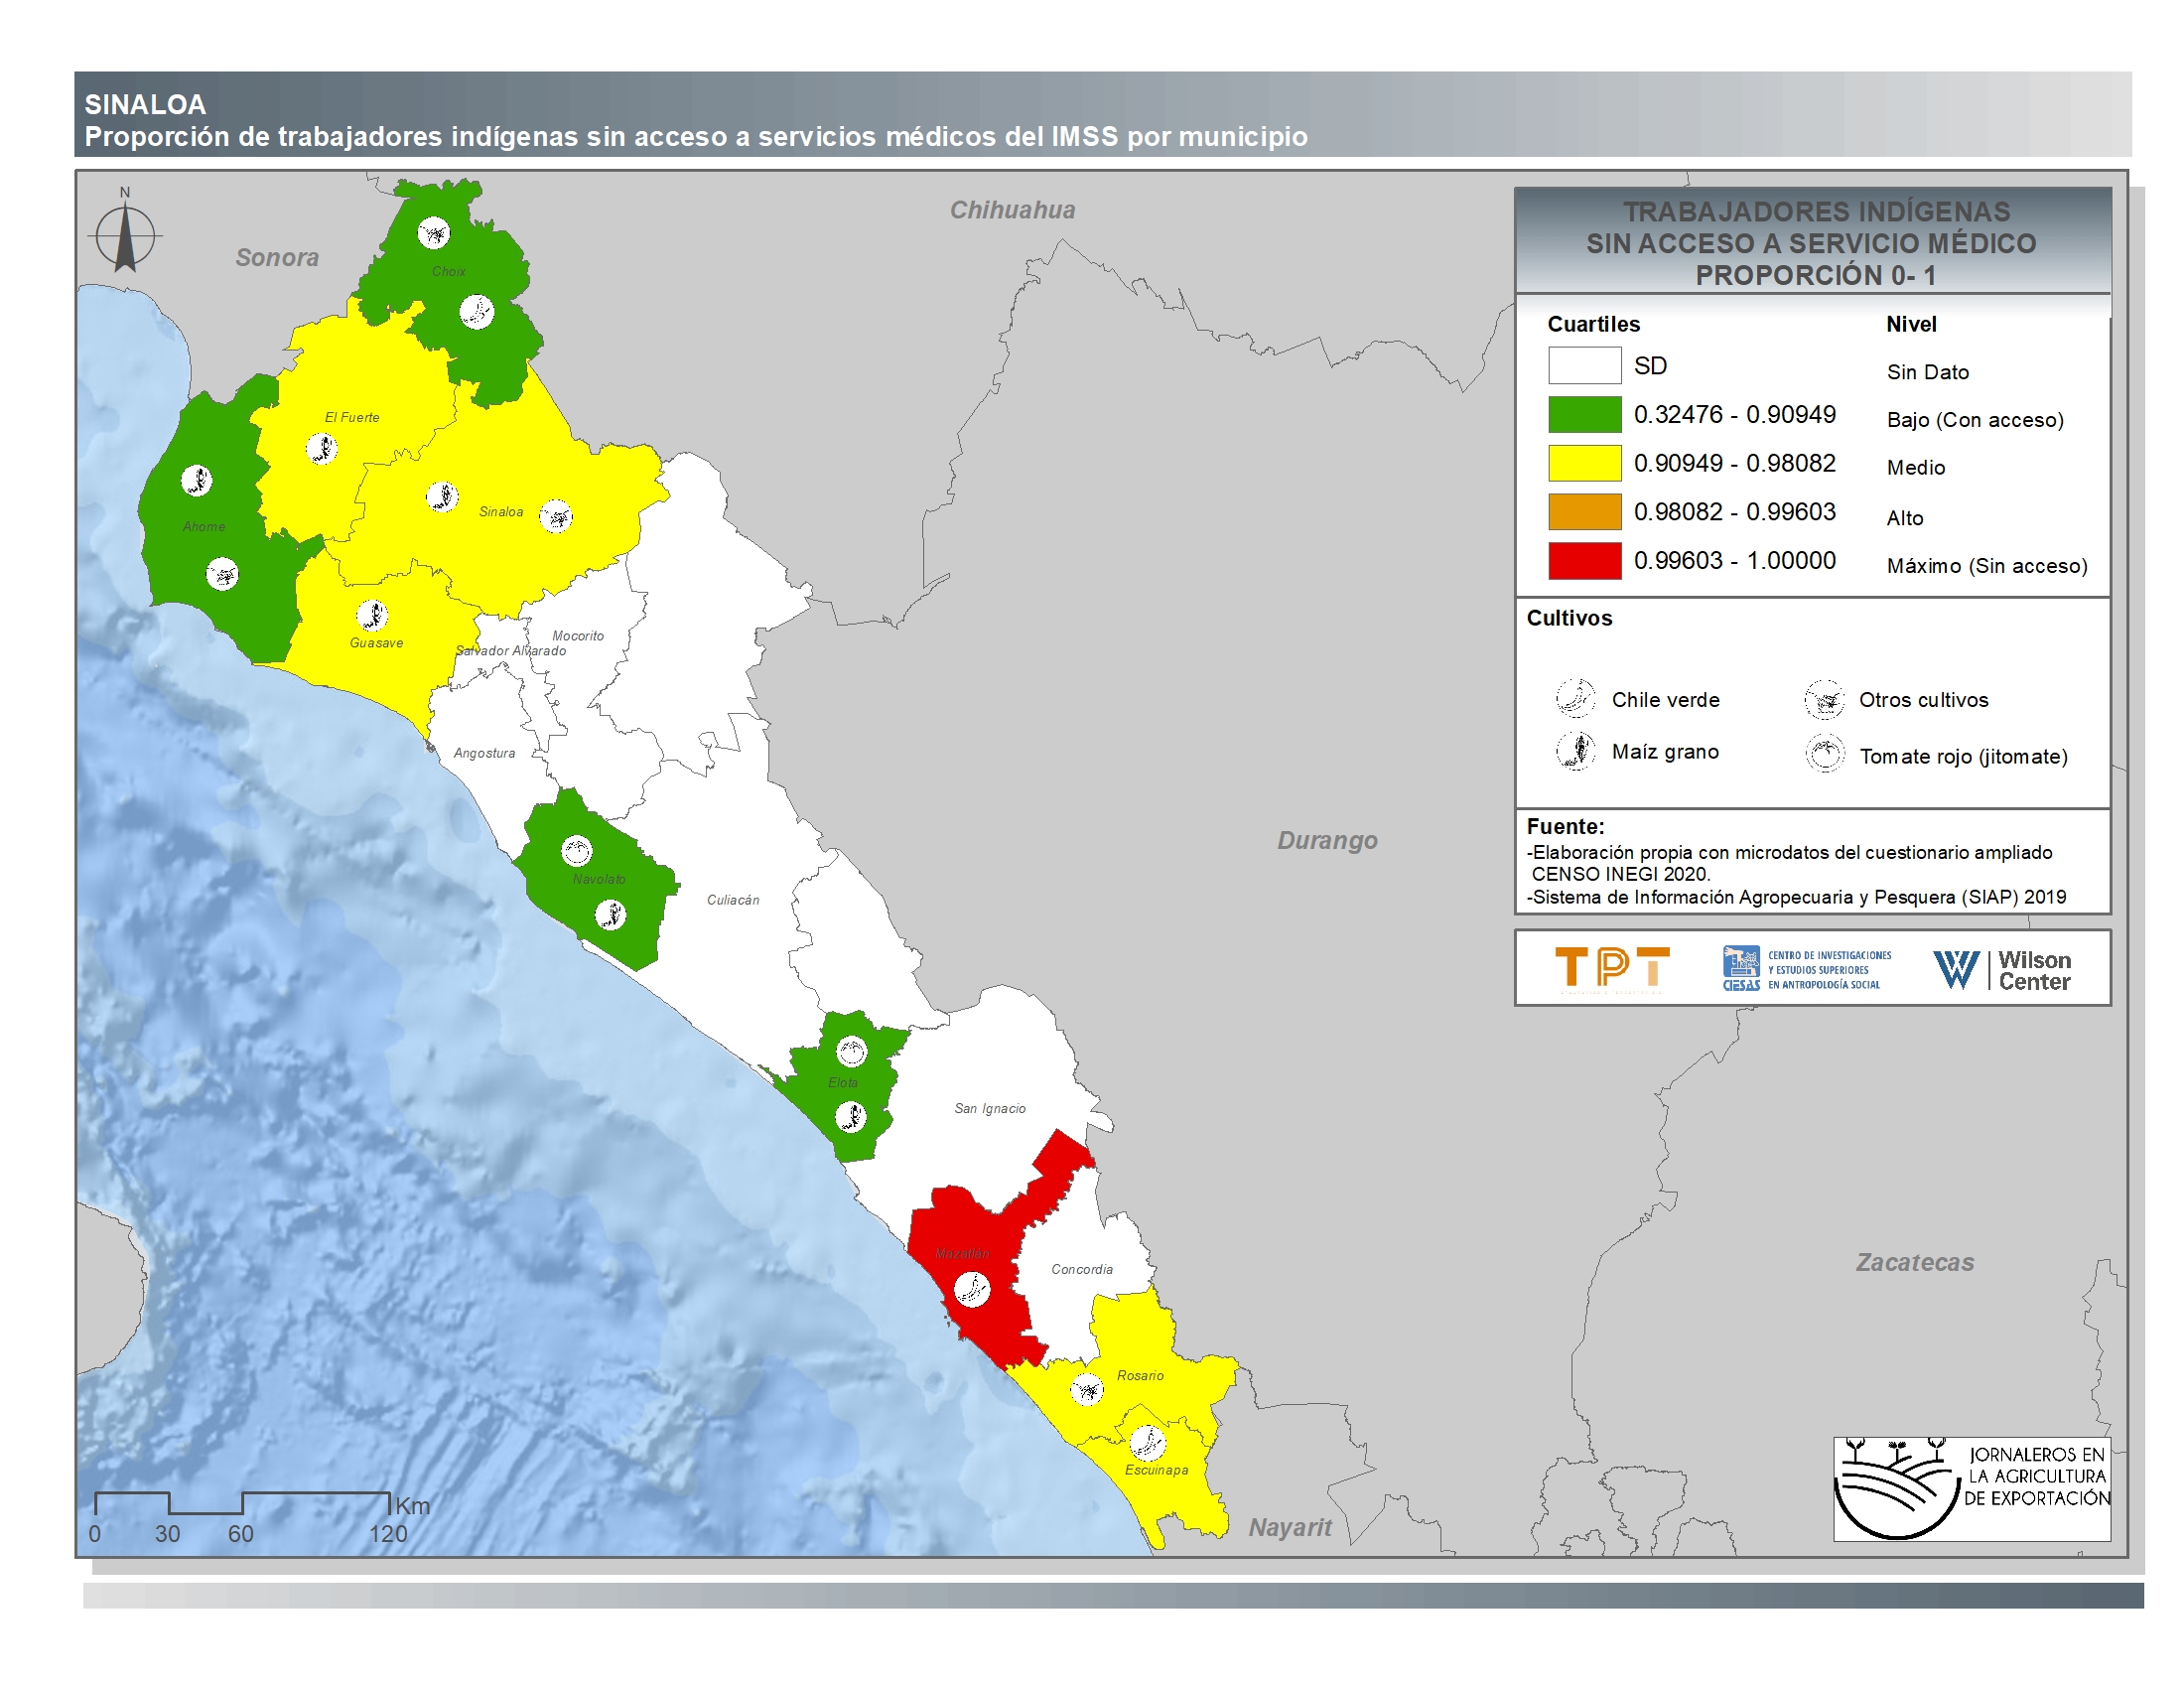
Sinaloa
-
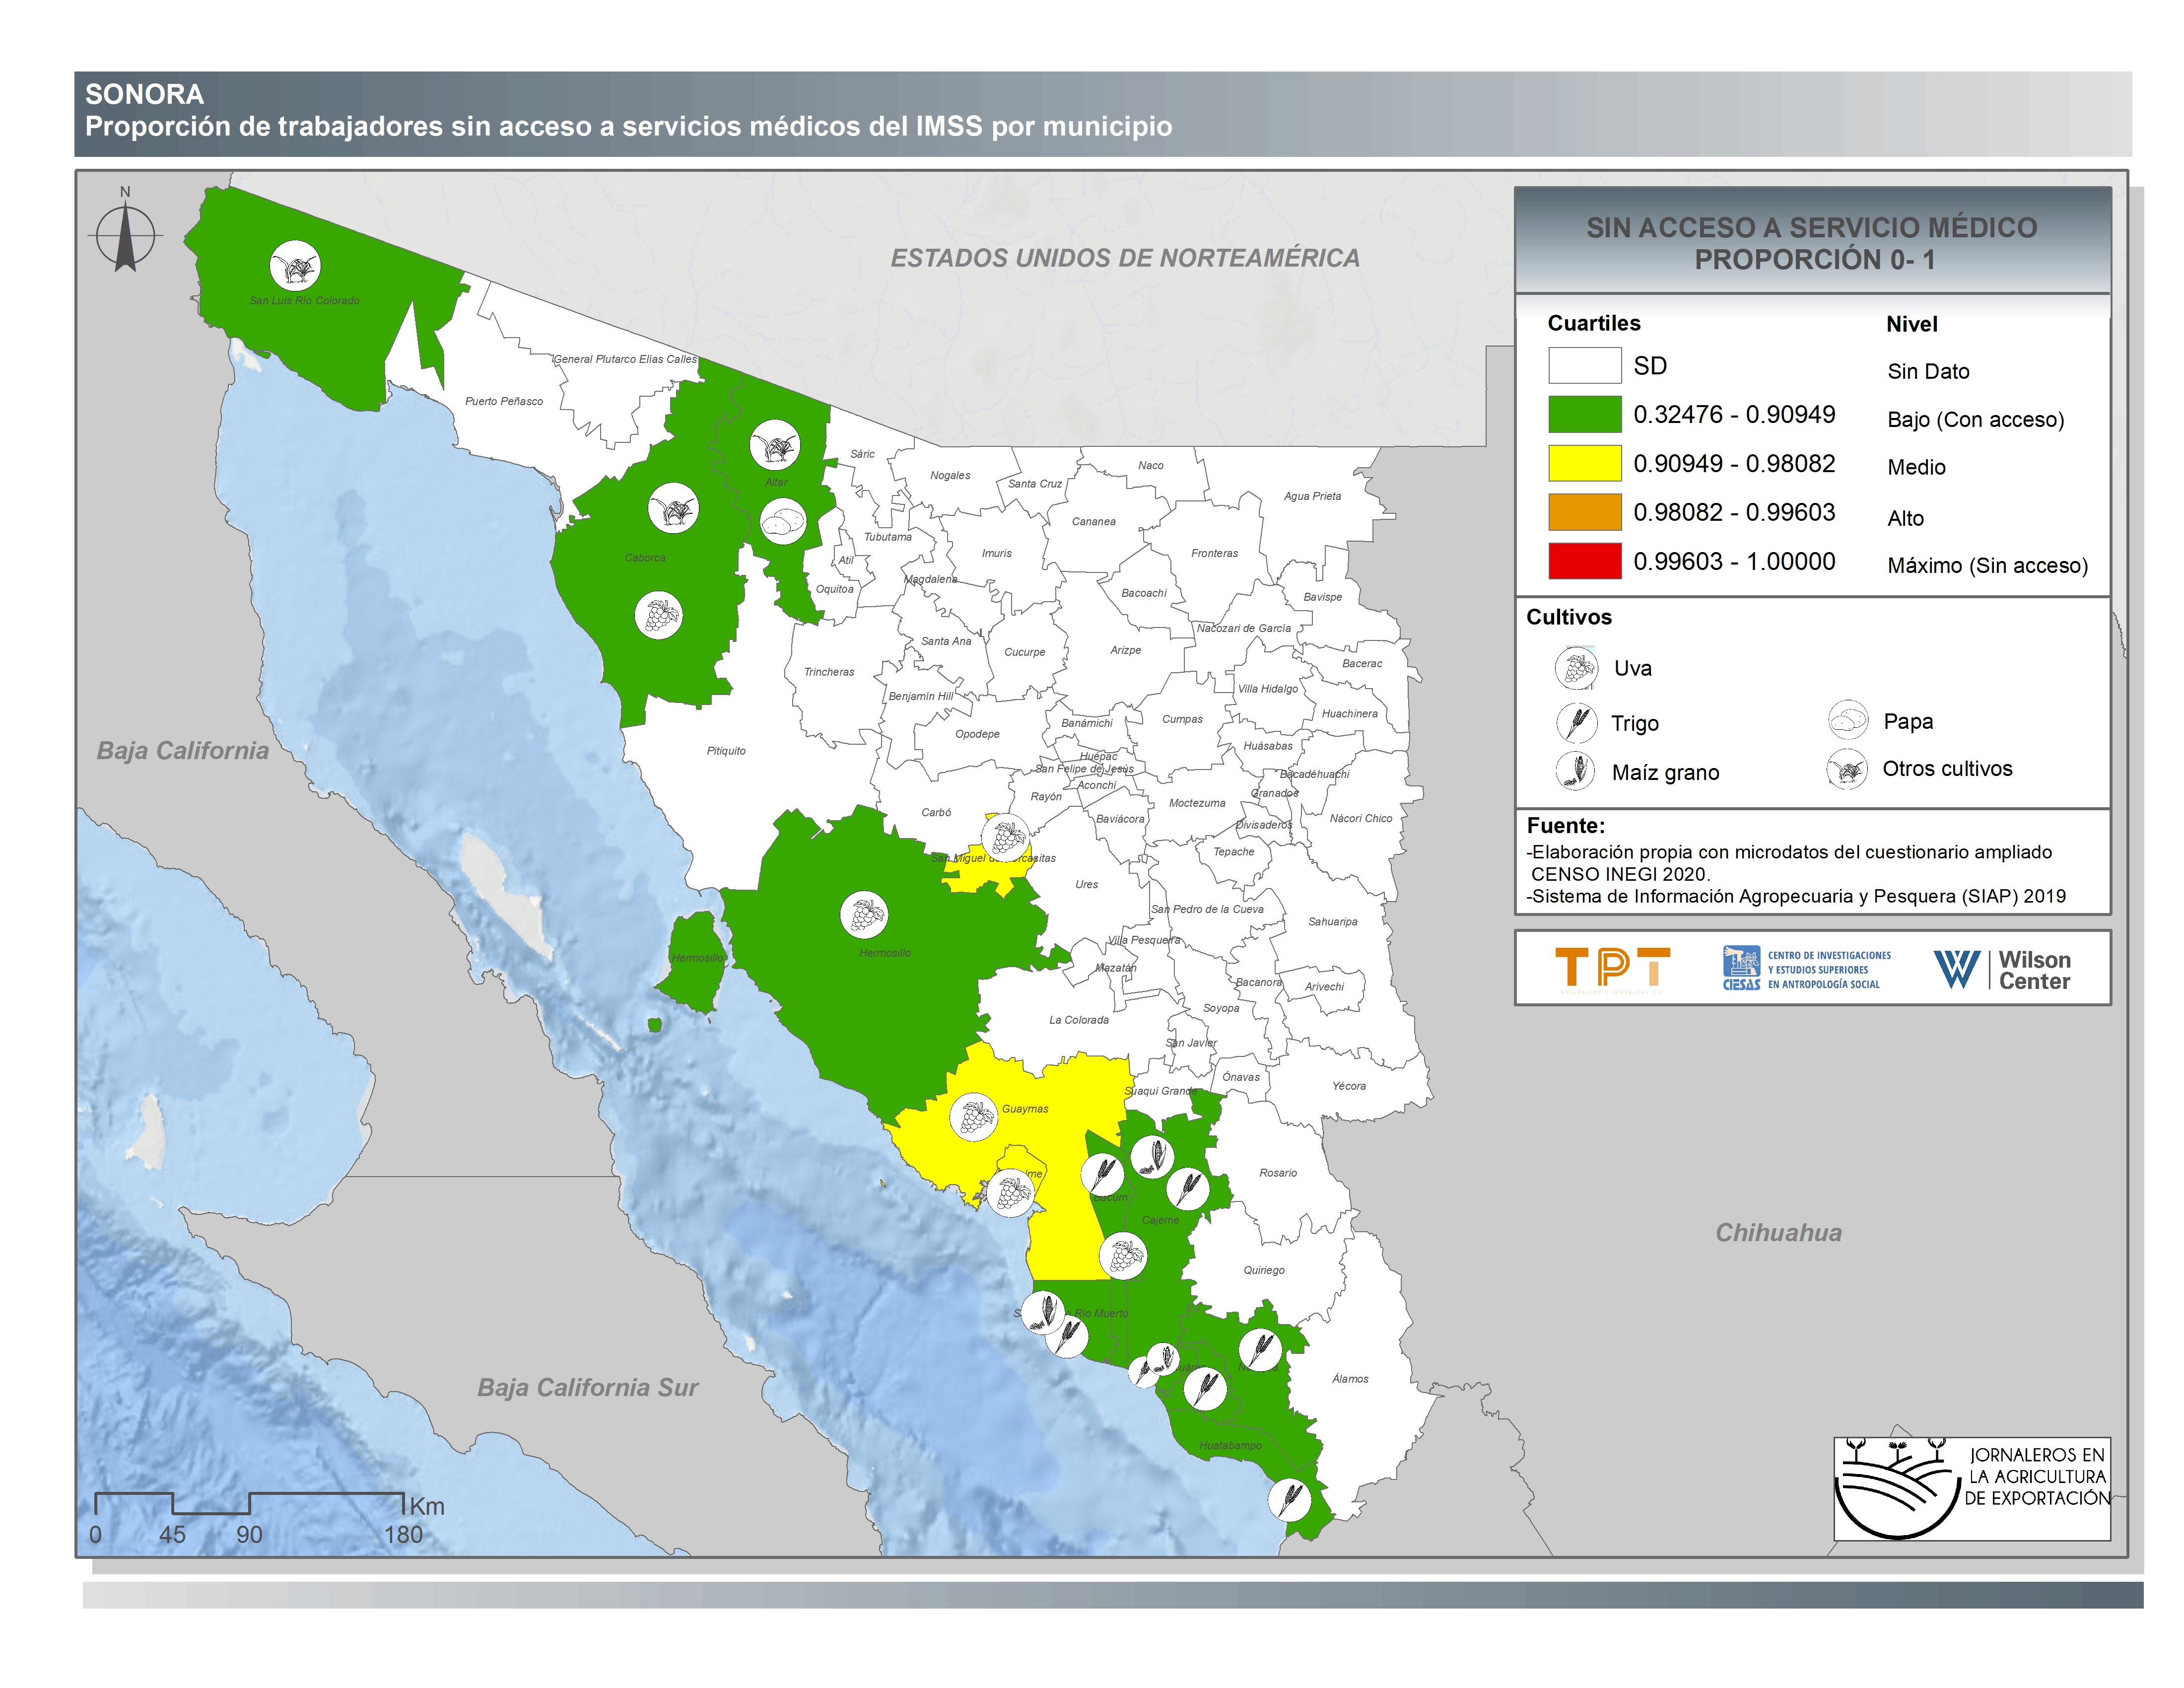
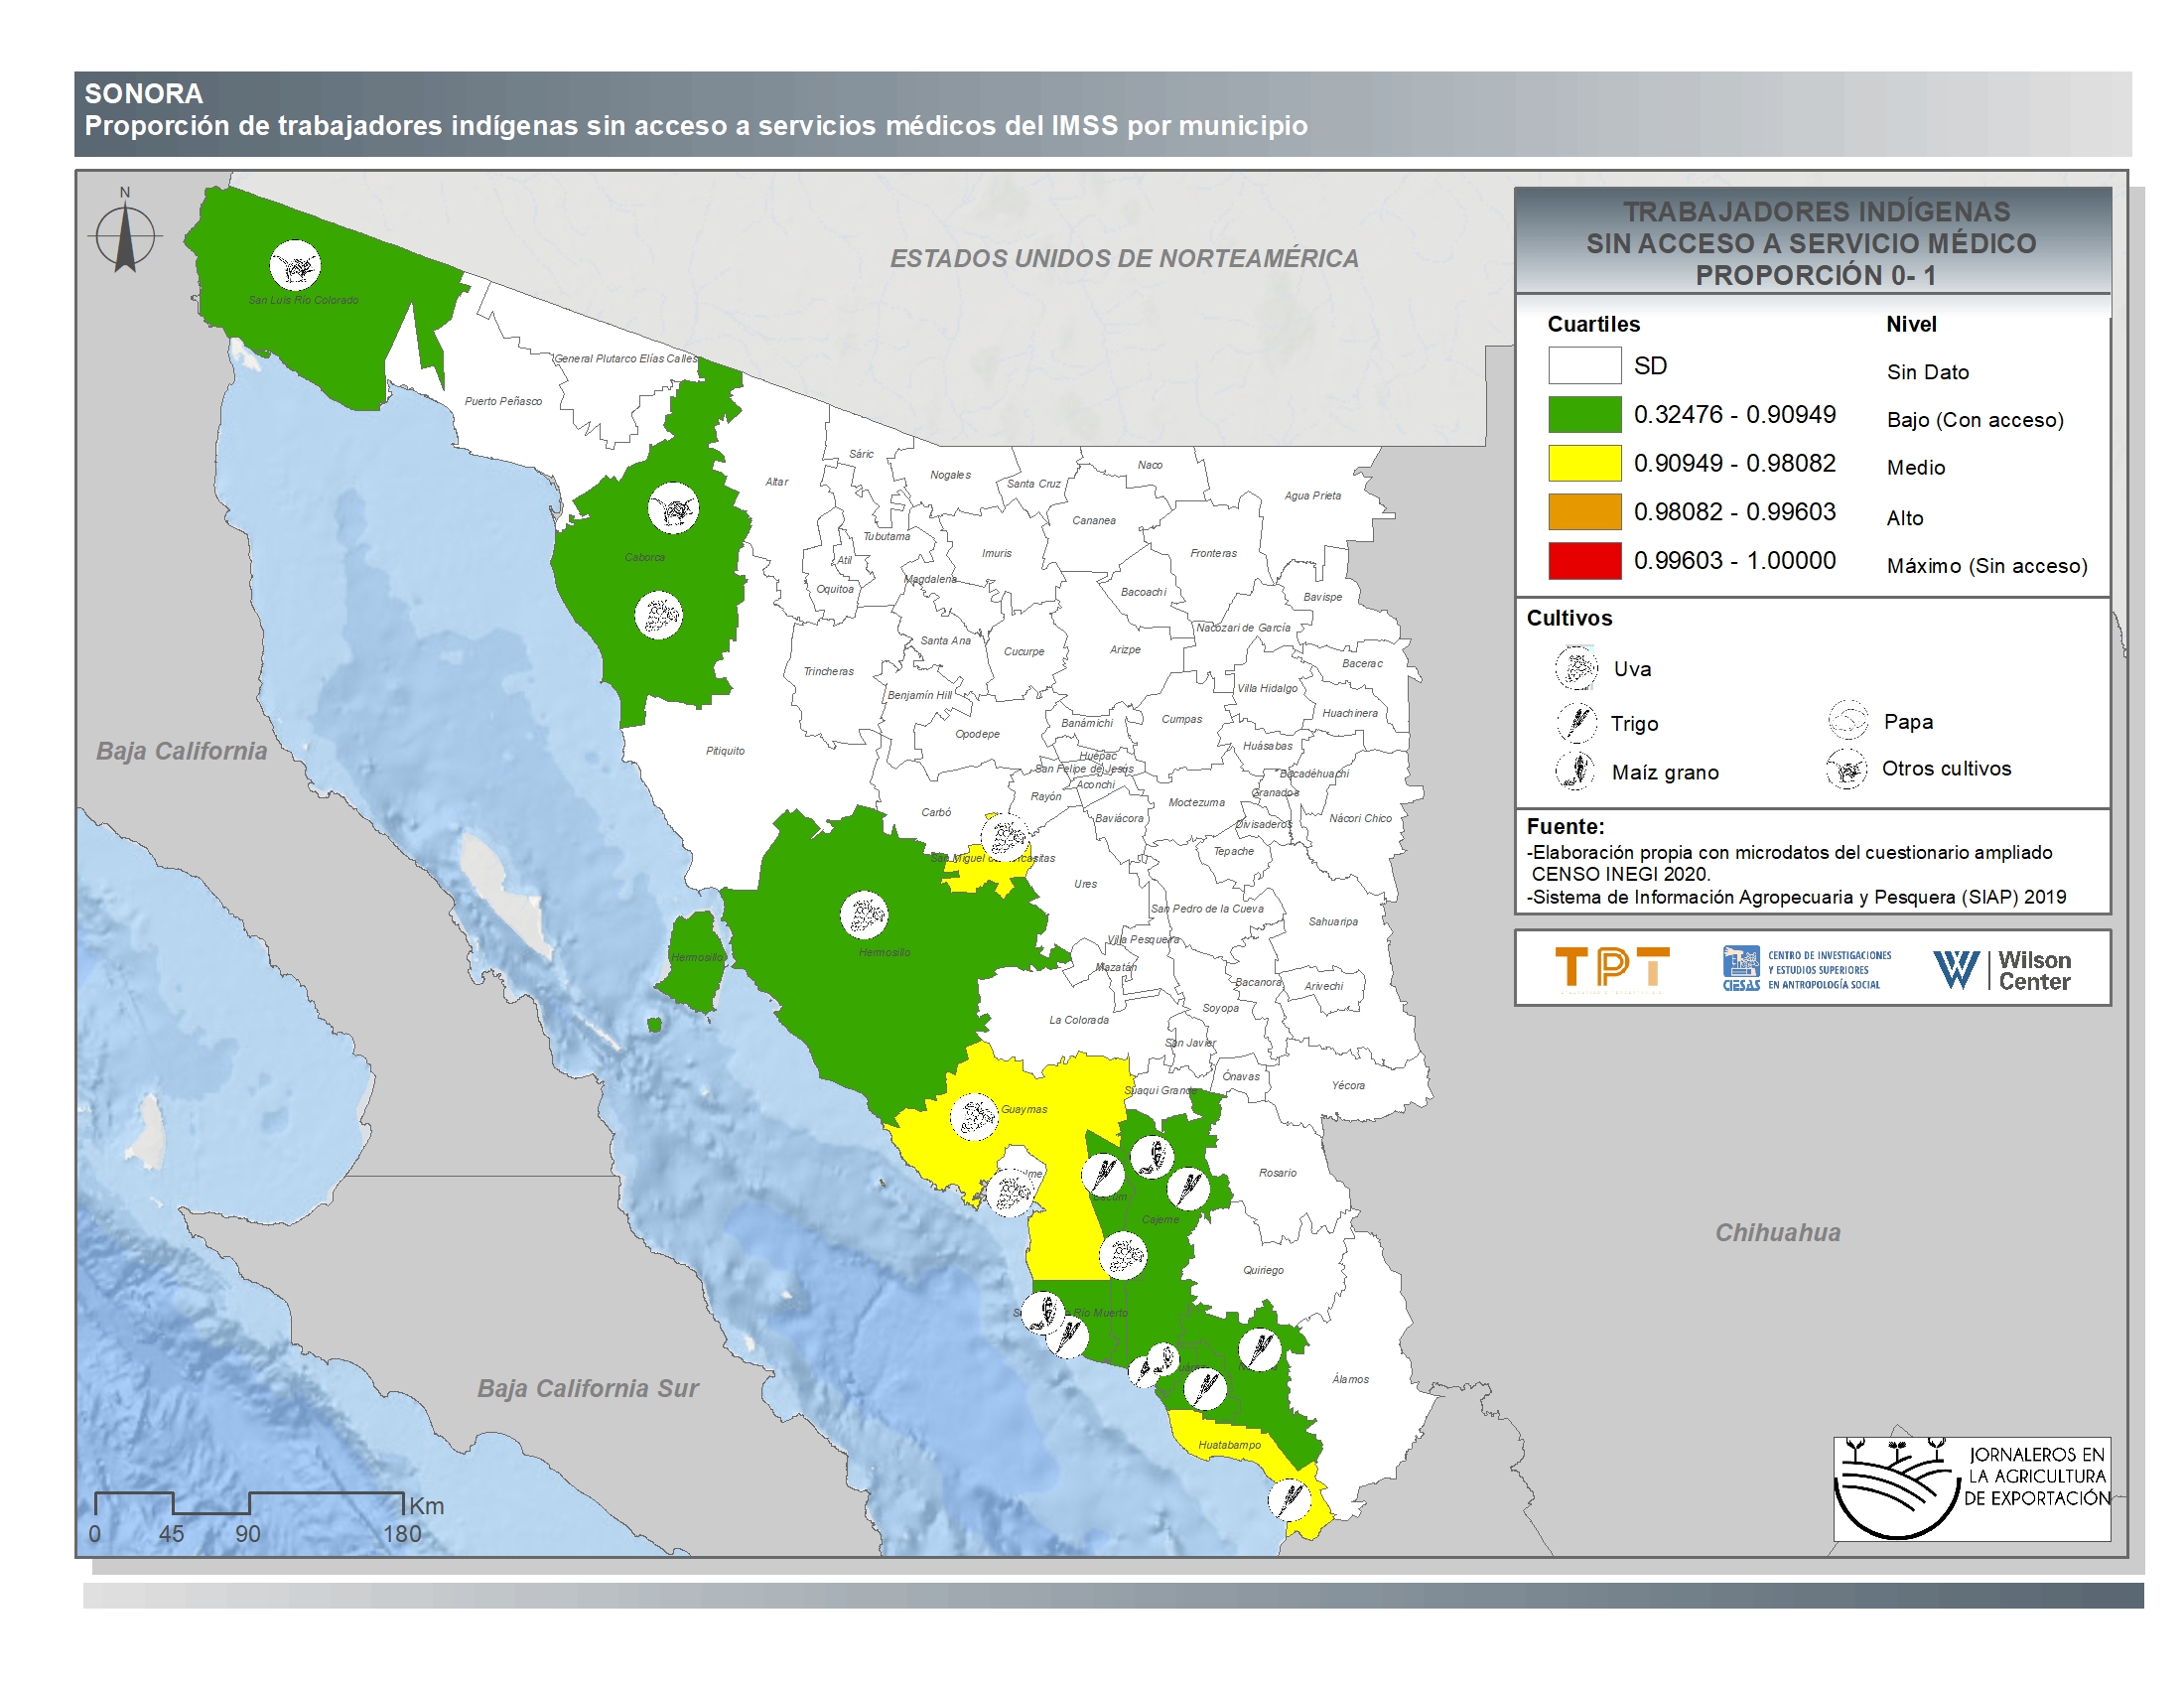
Sonora
-
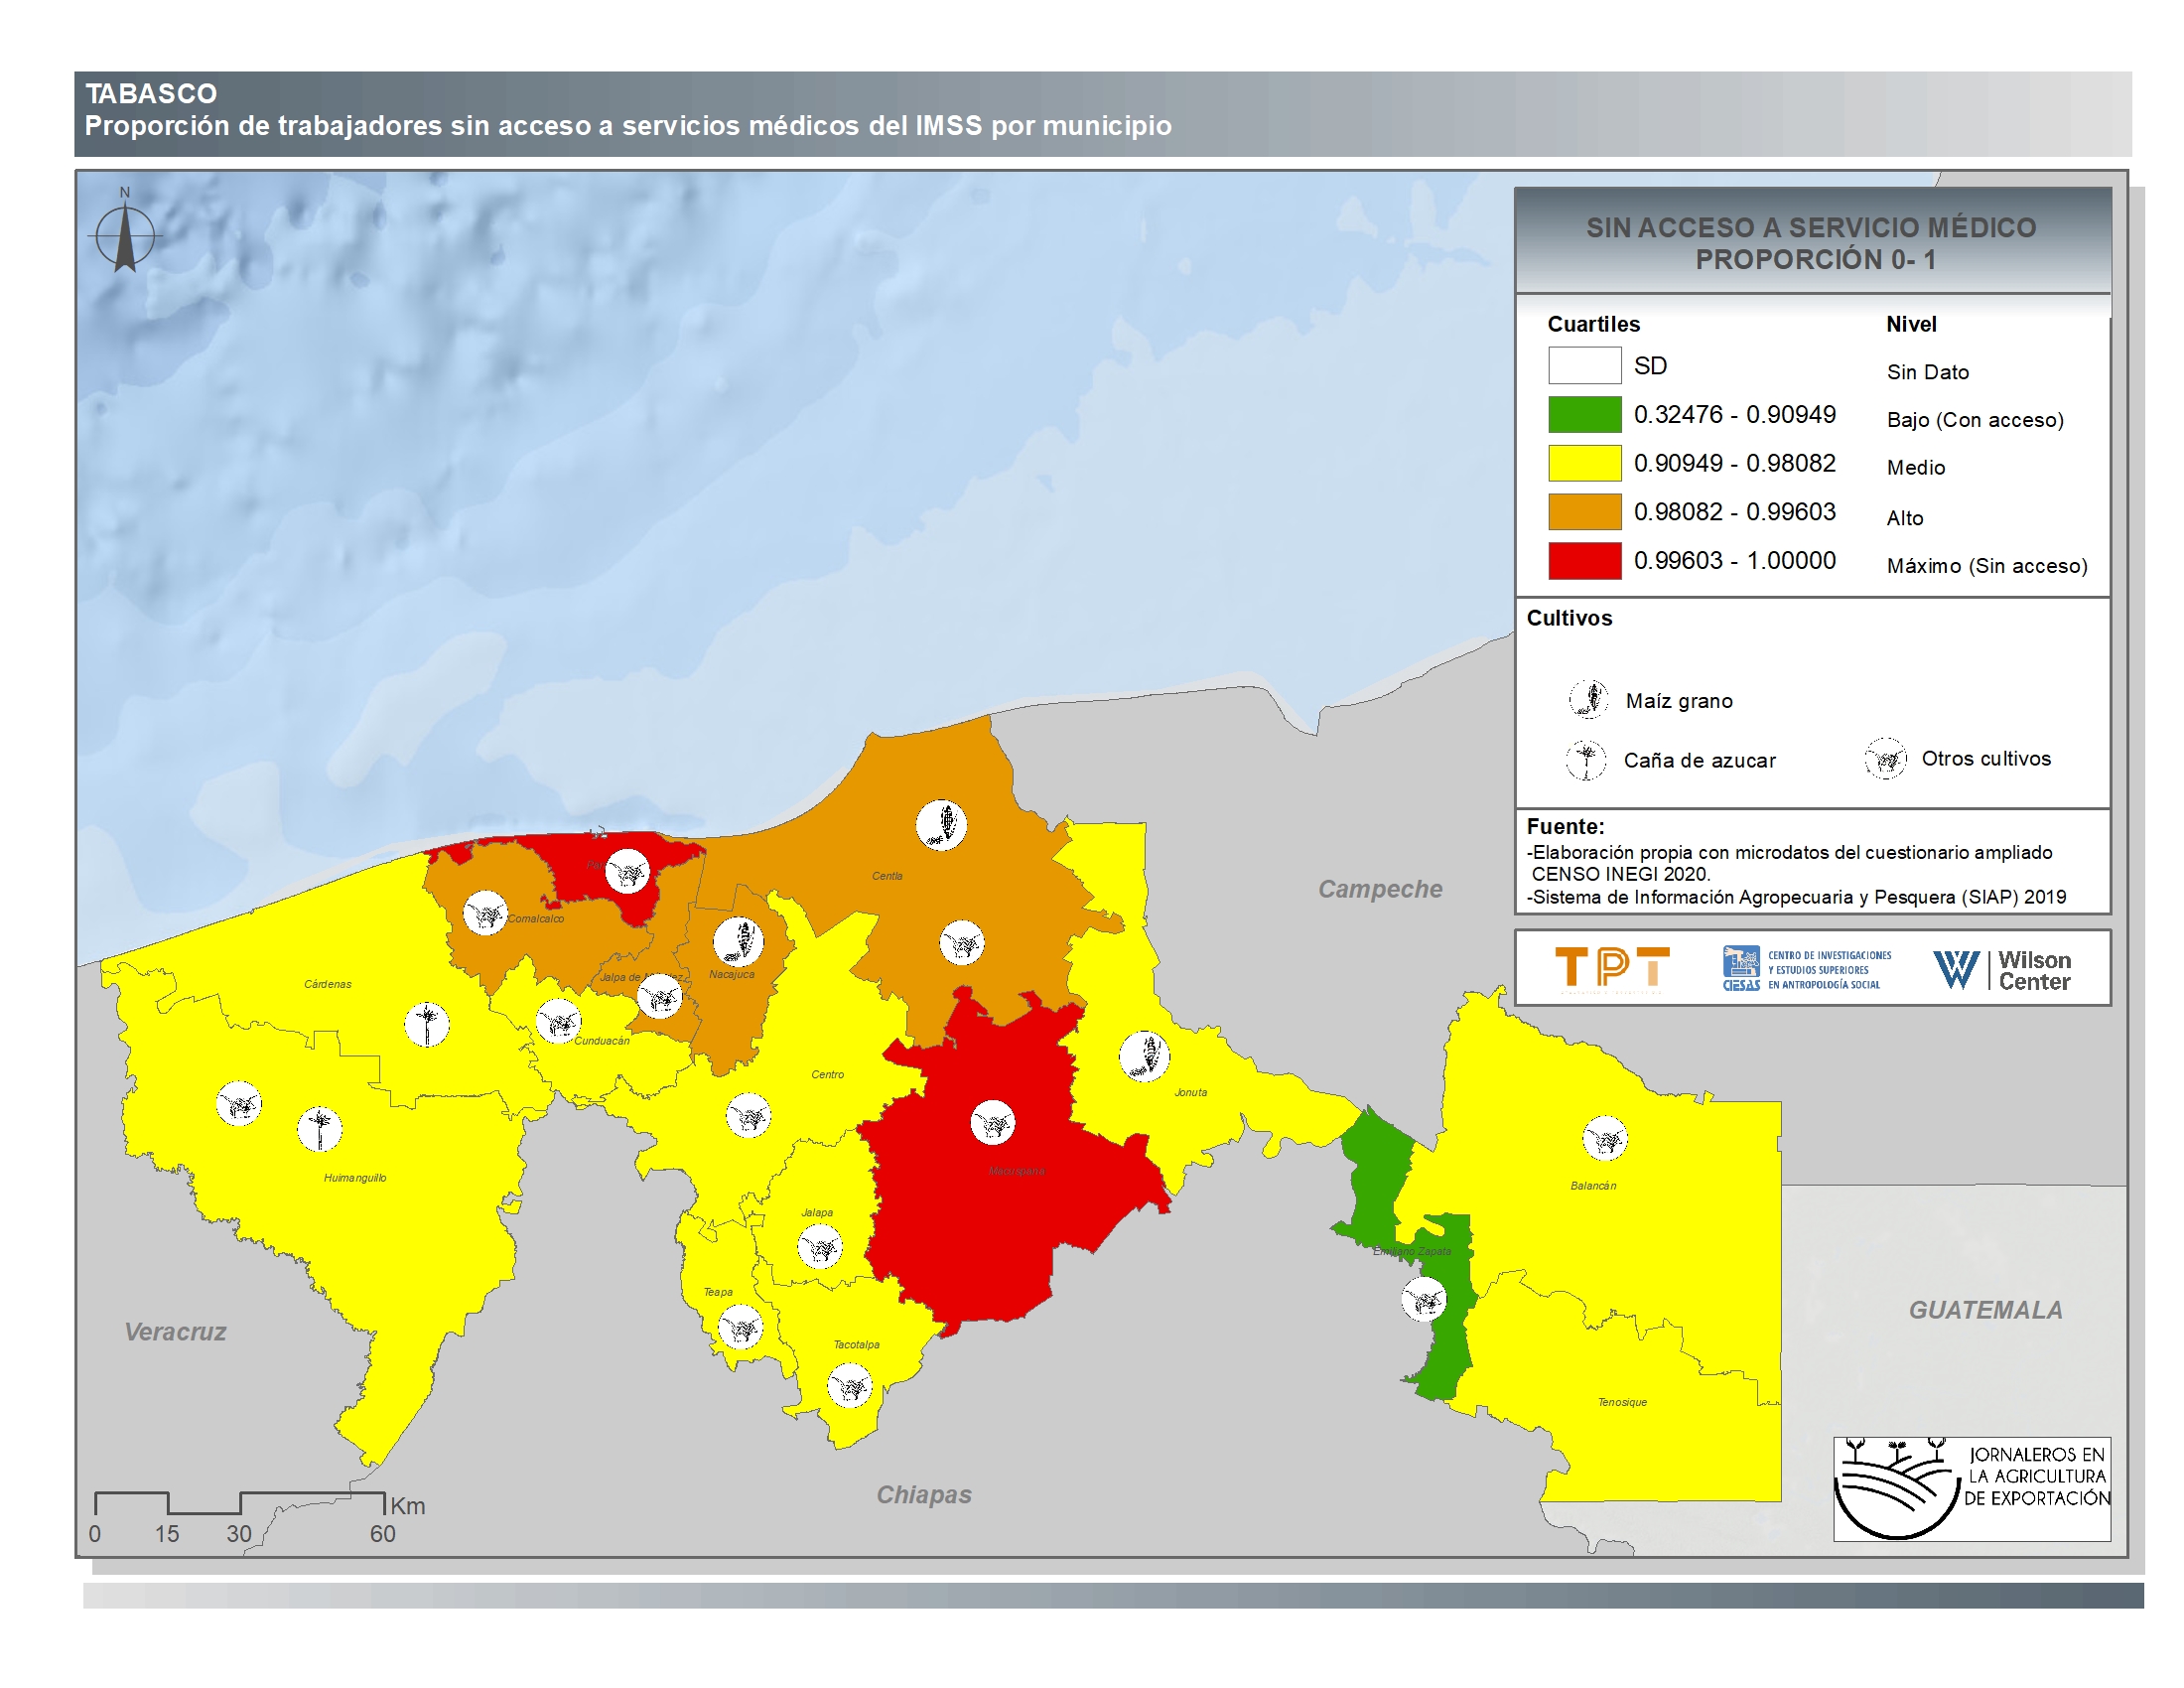
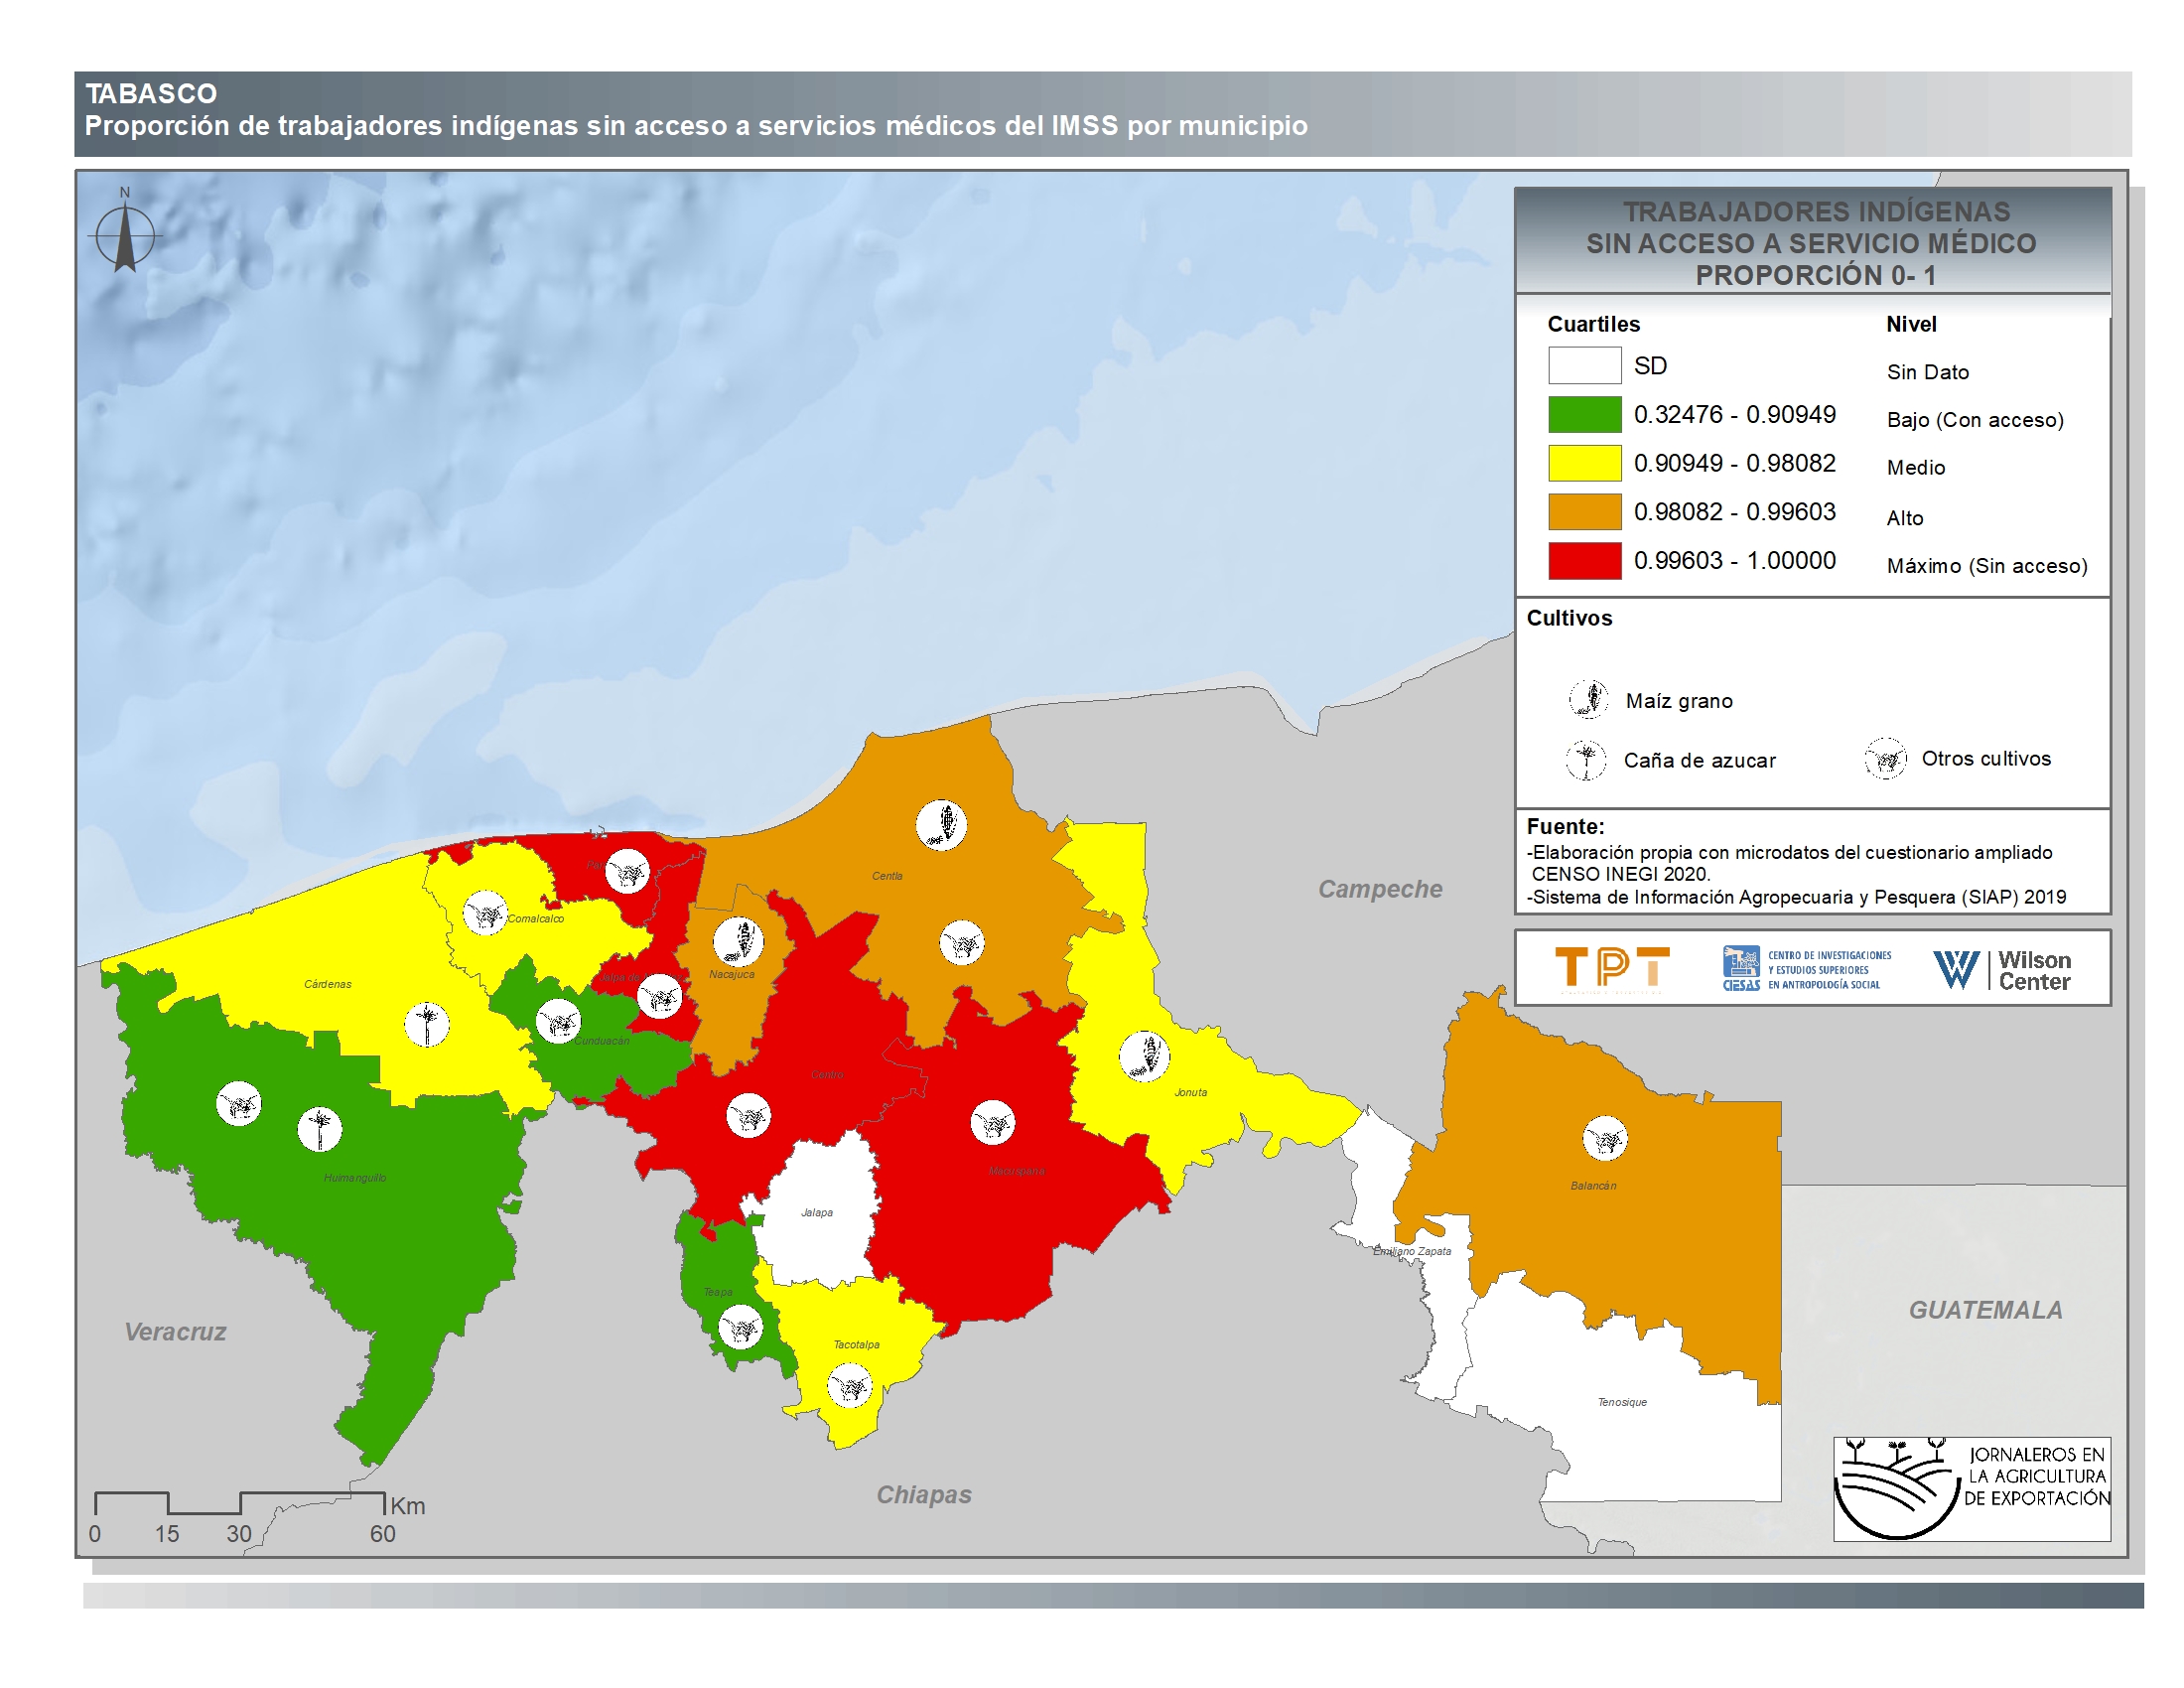
Tabasco
-
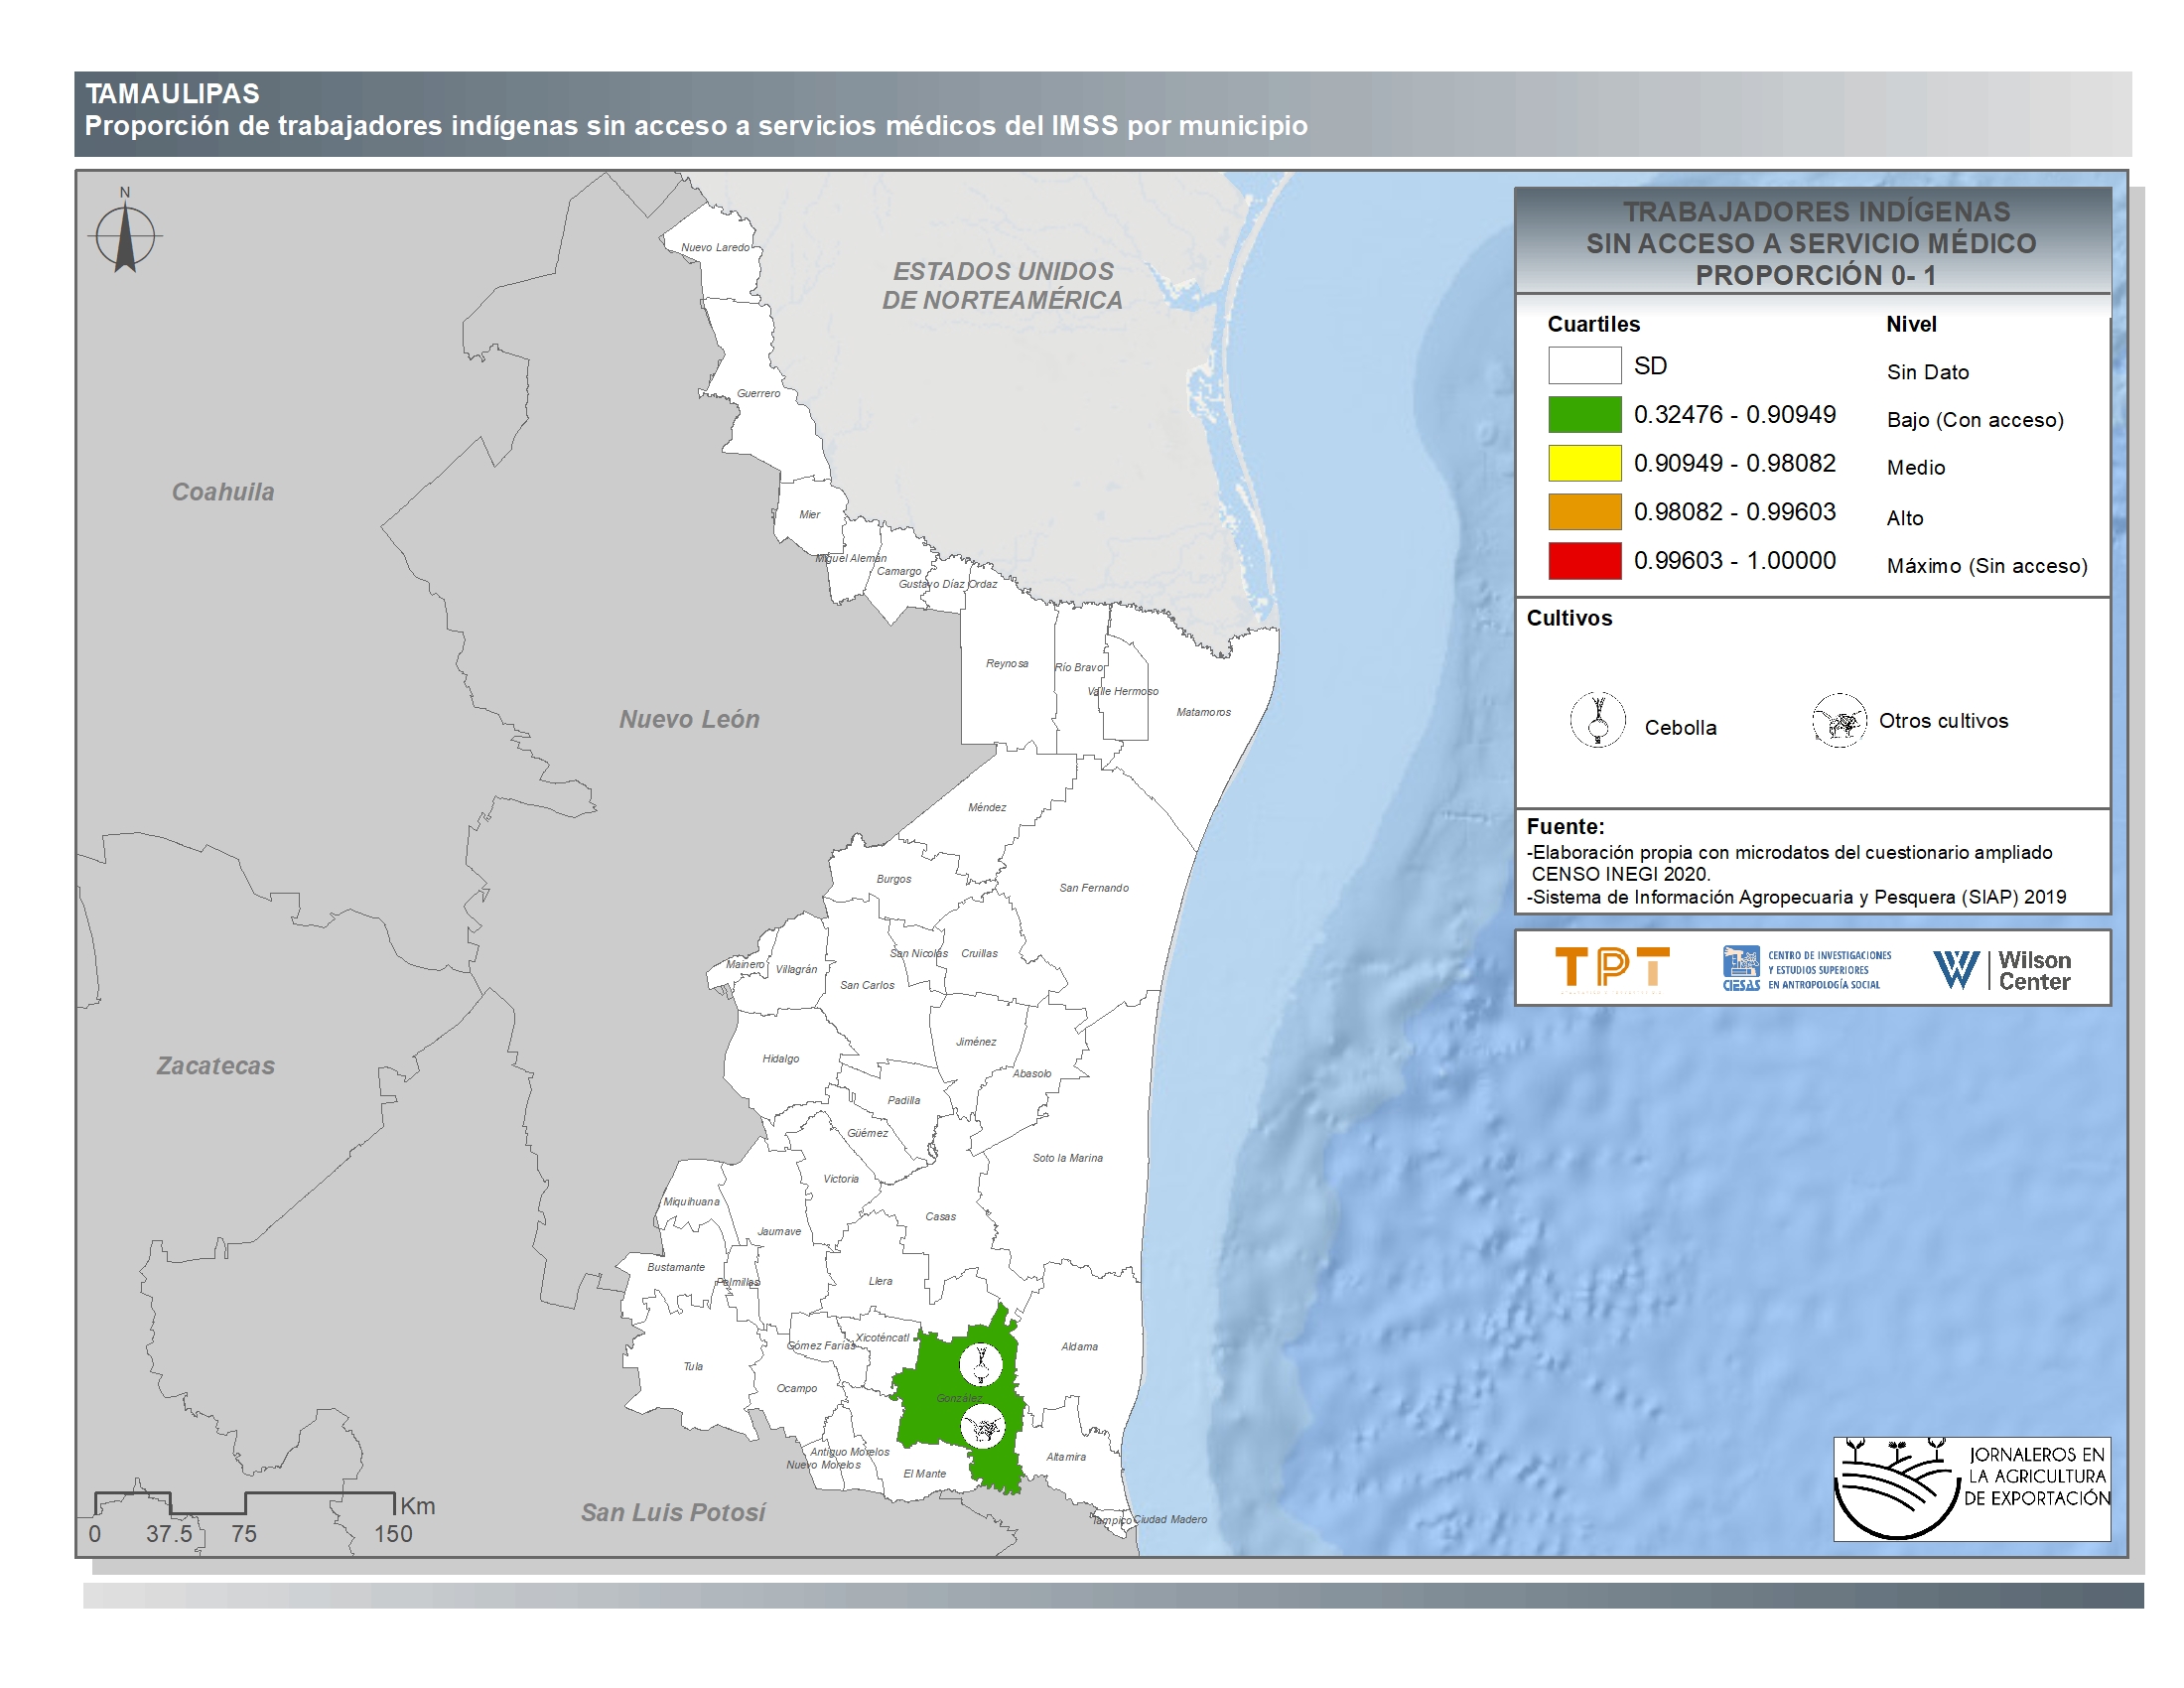
Tamaulipas
-
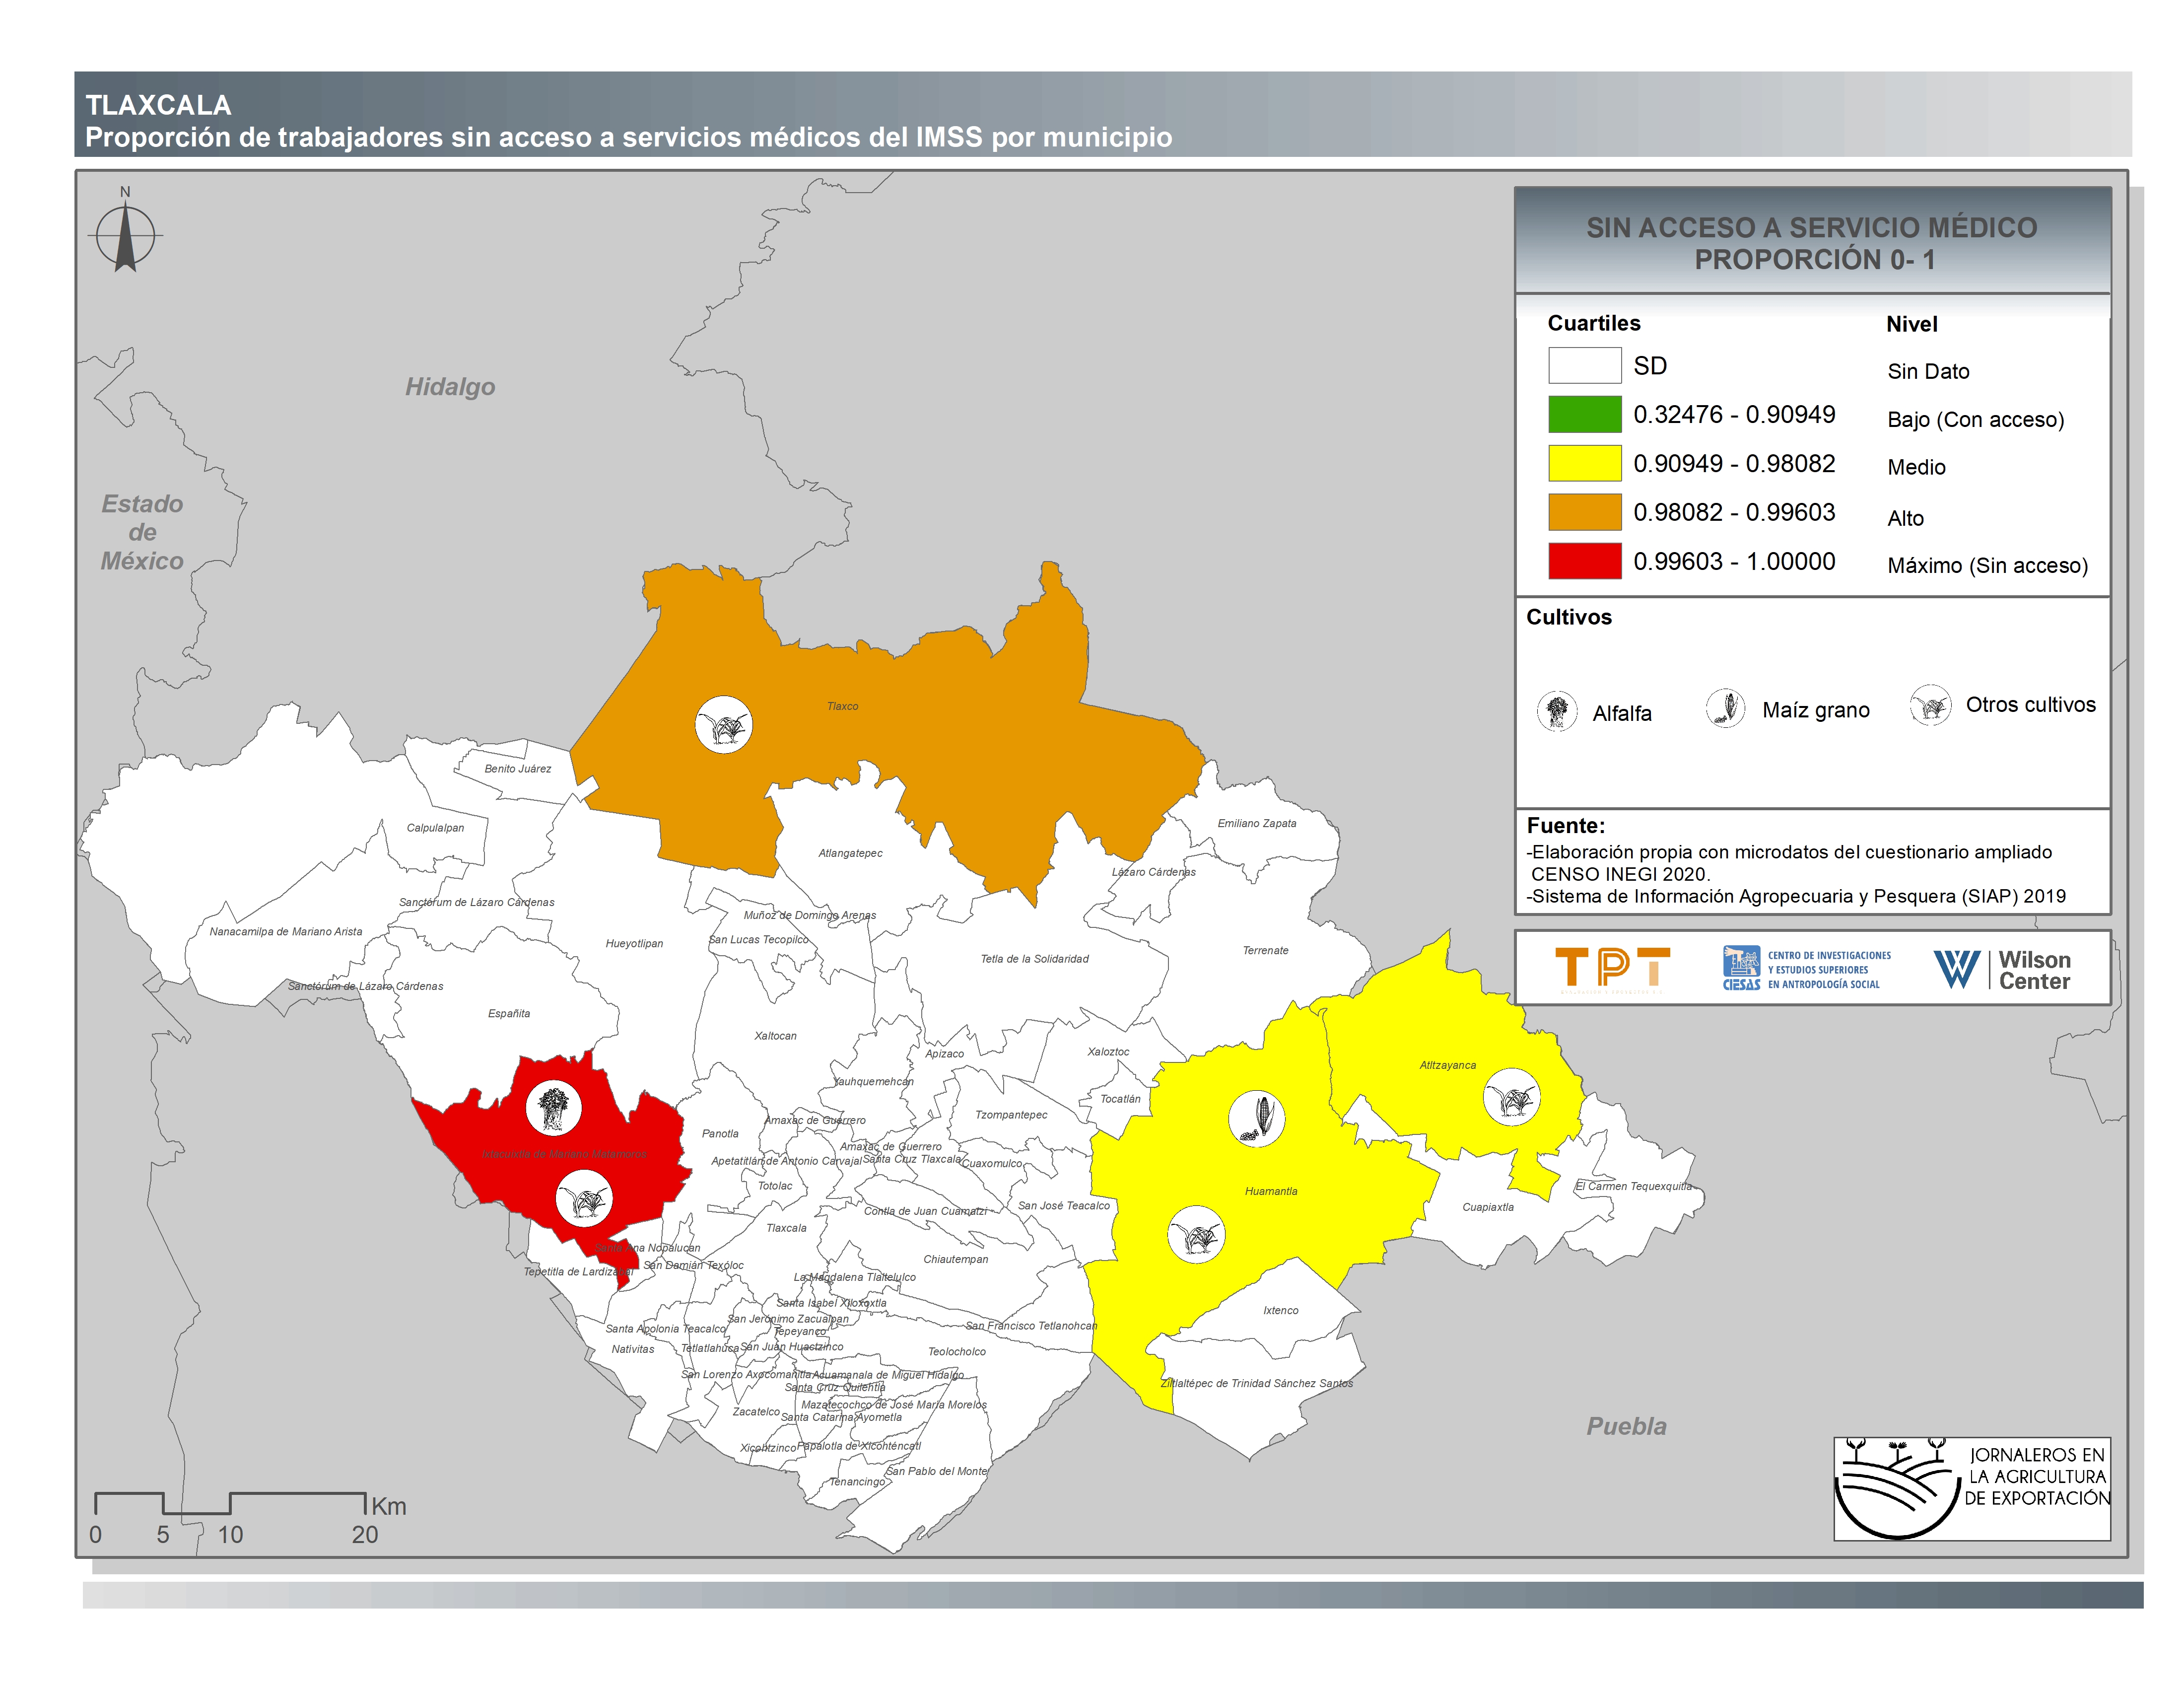
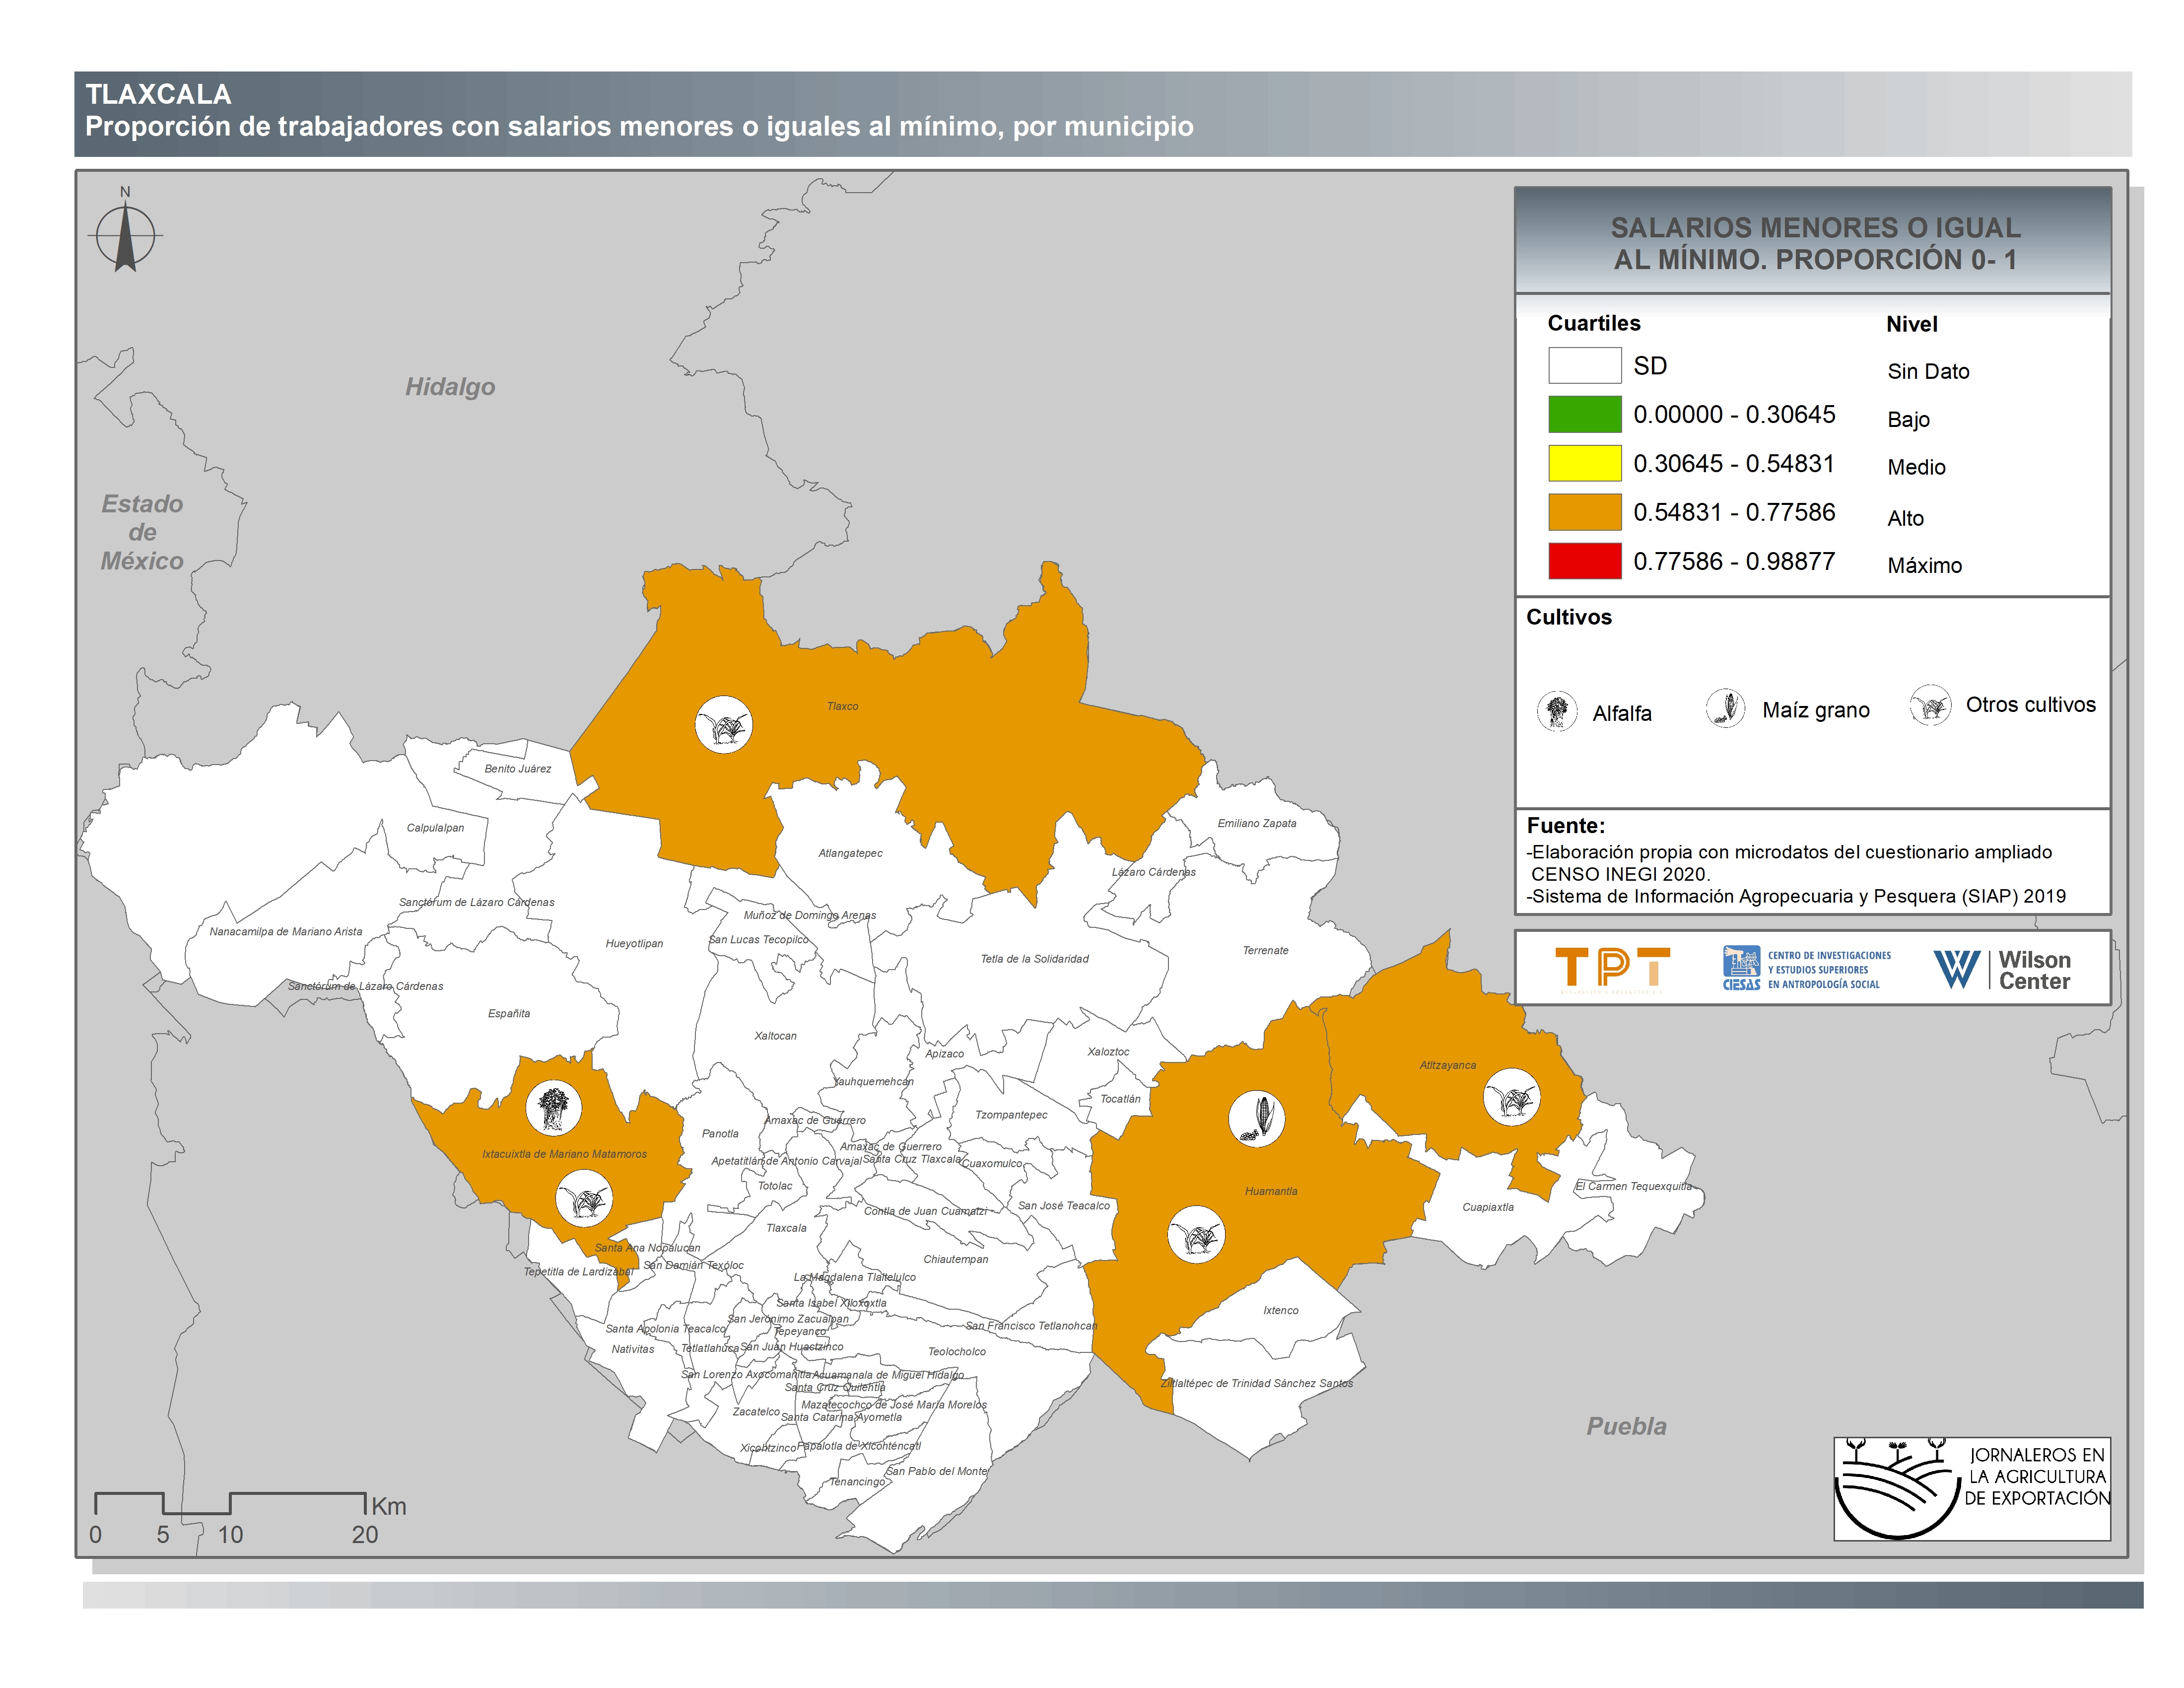
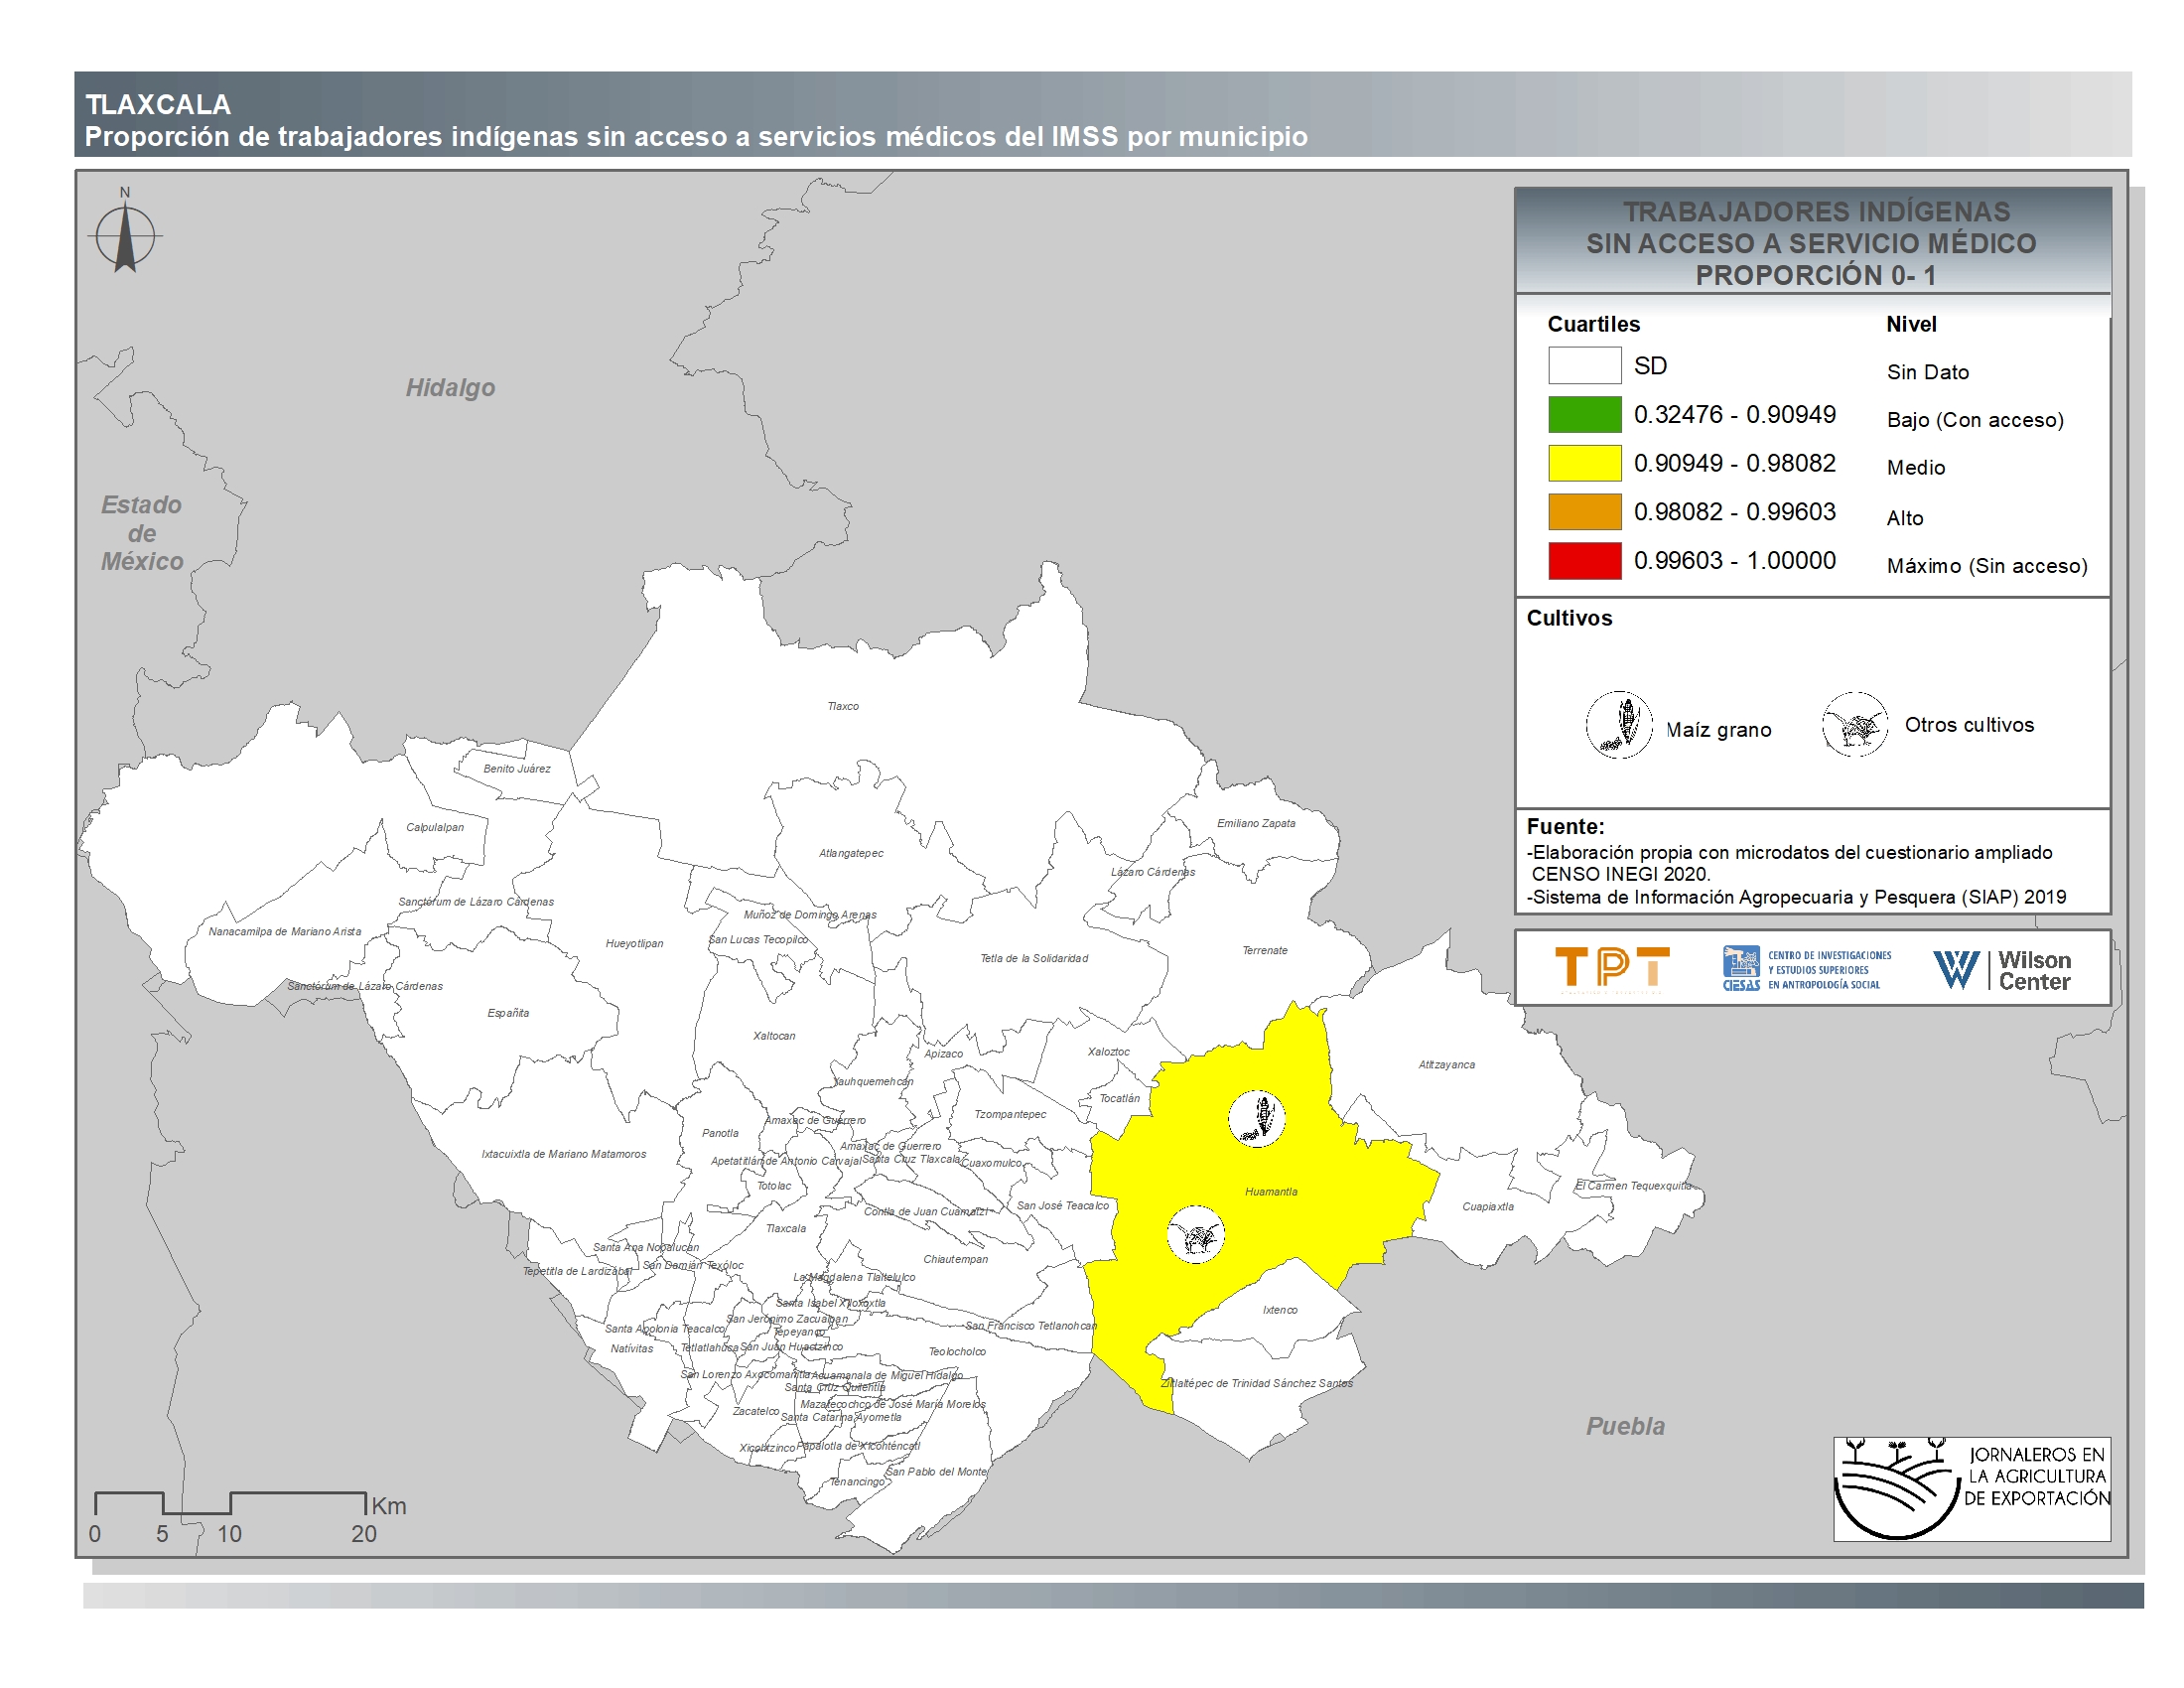
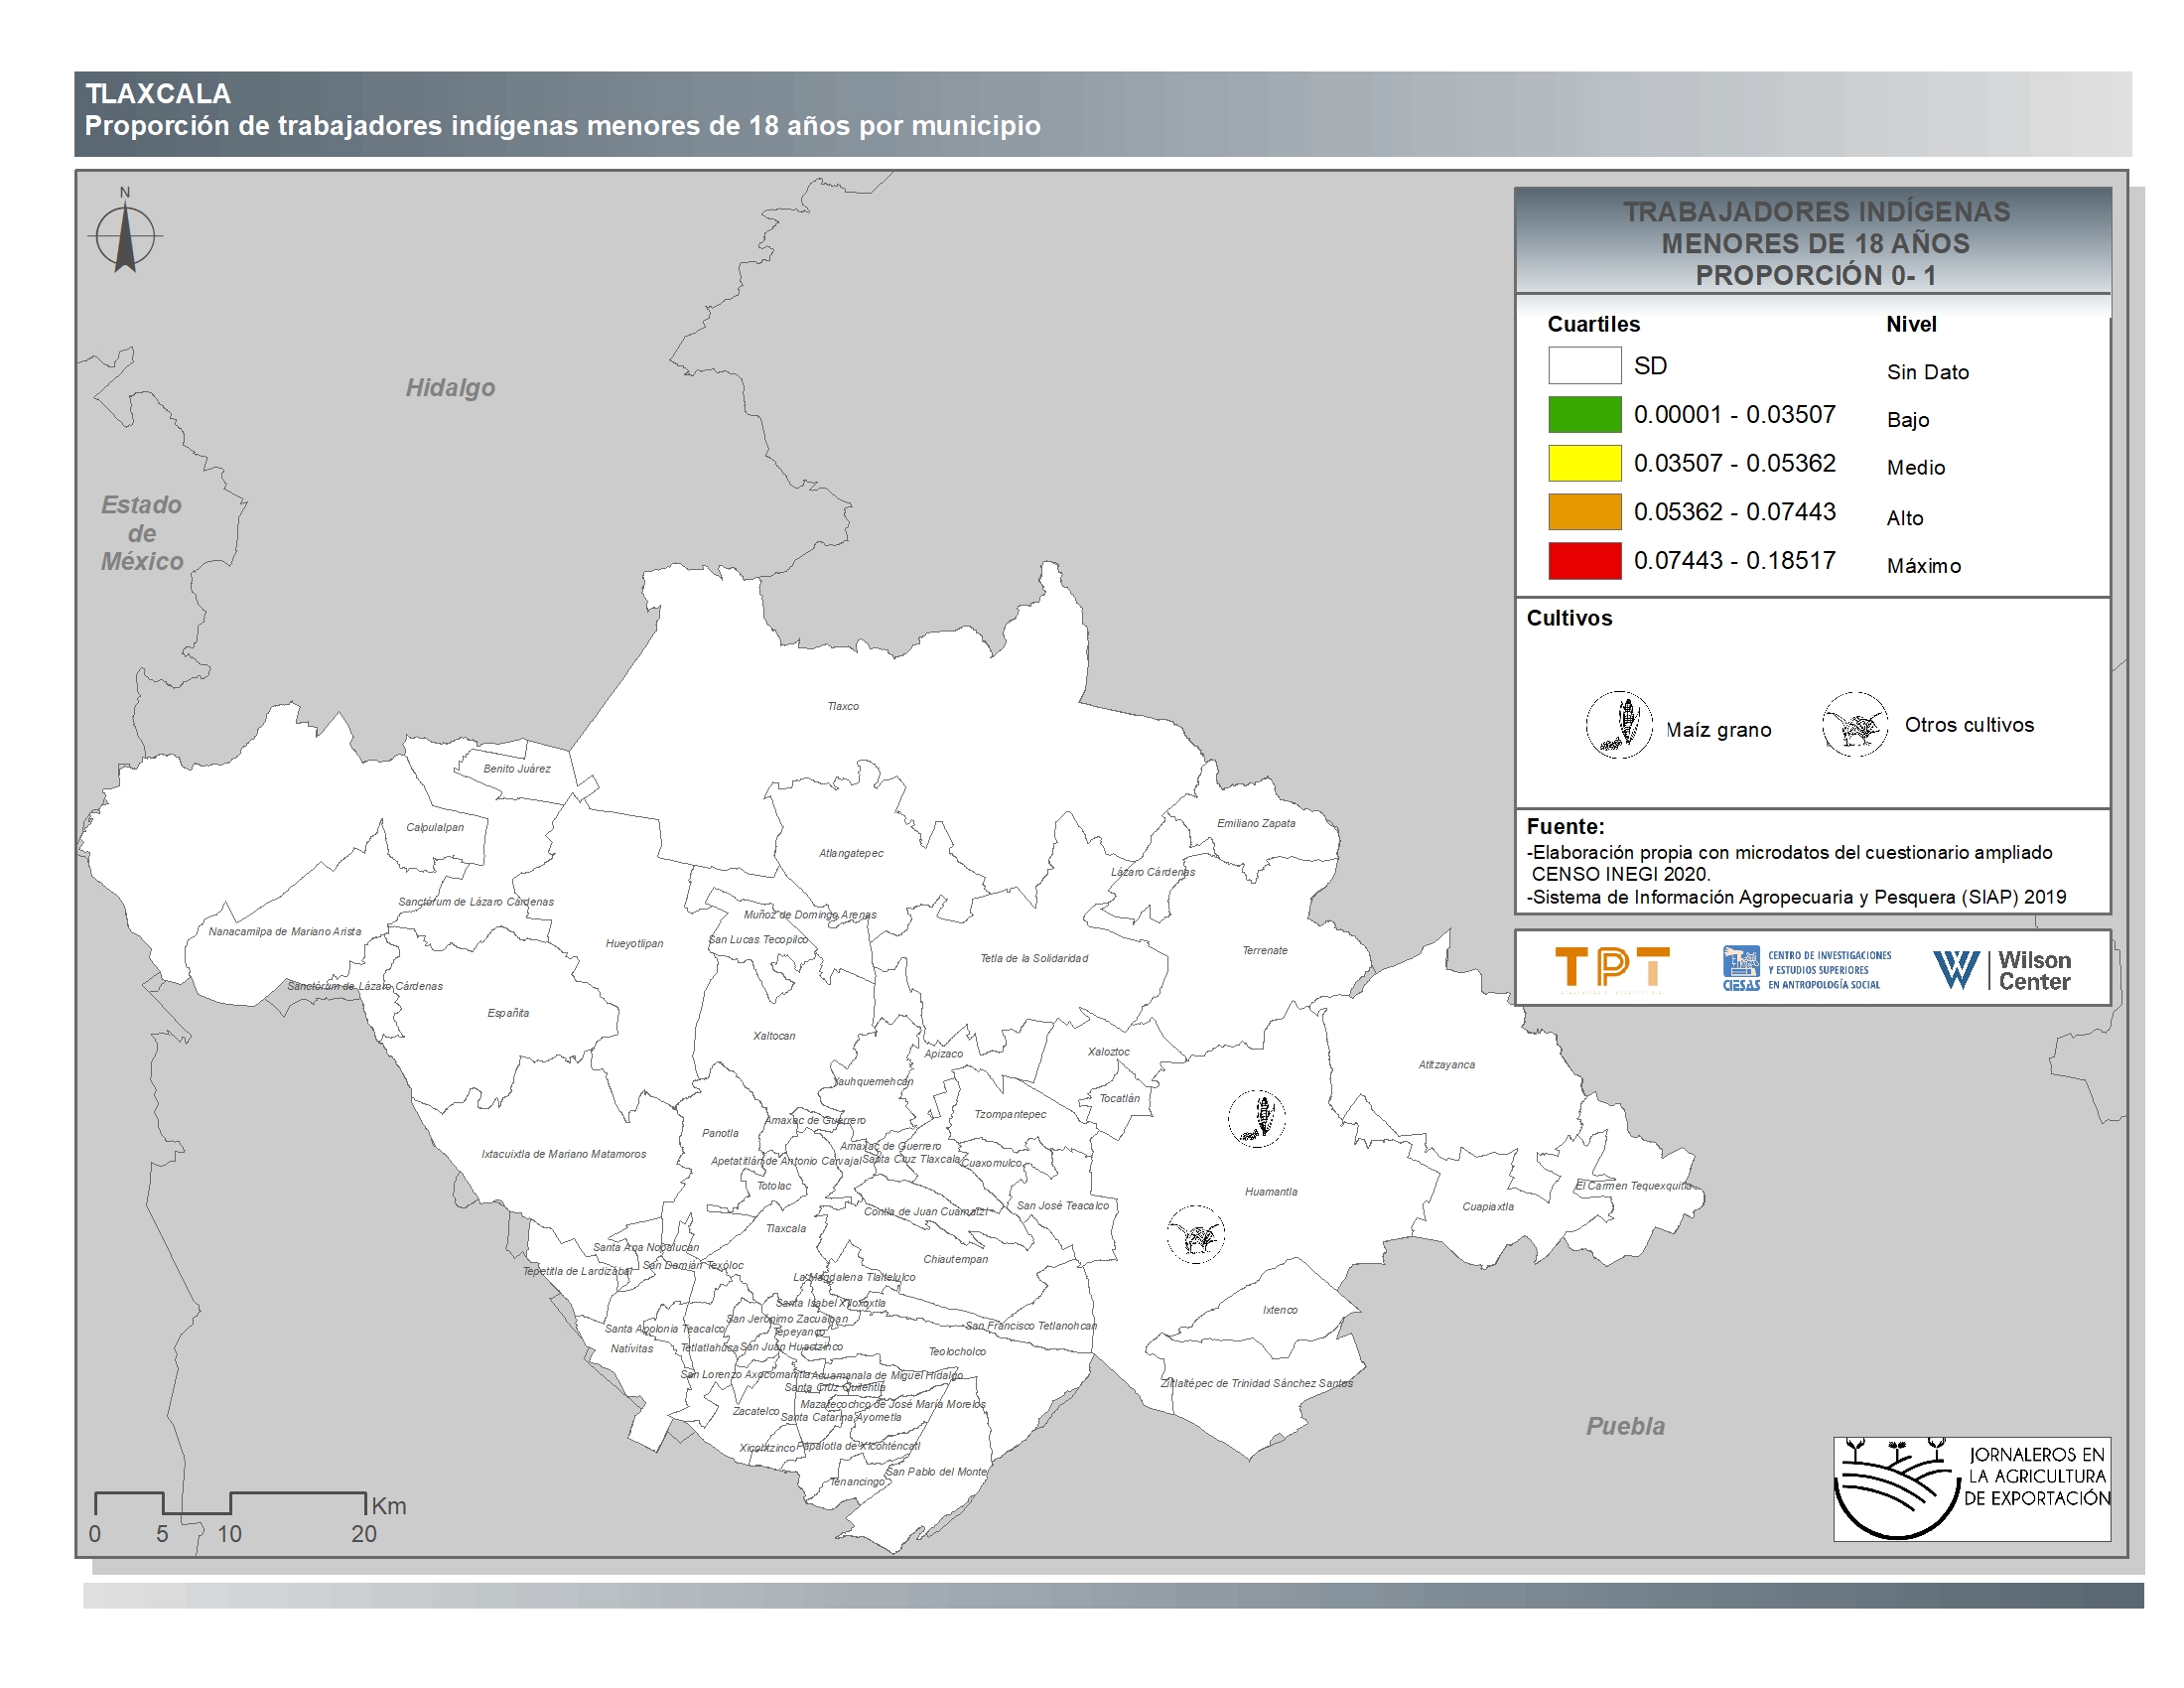
Tlaxcala
-
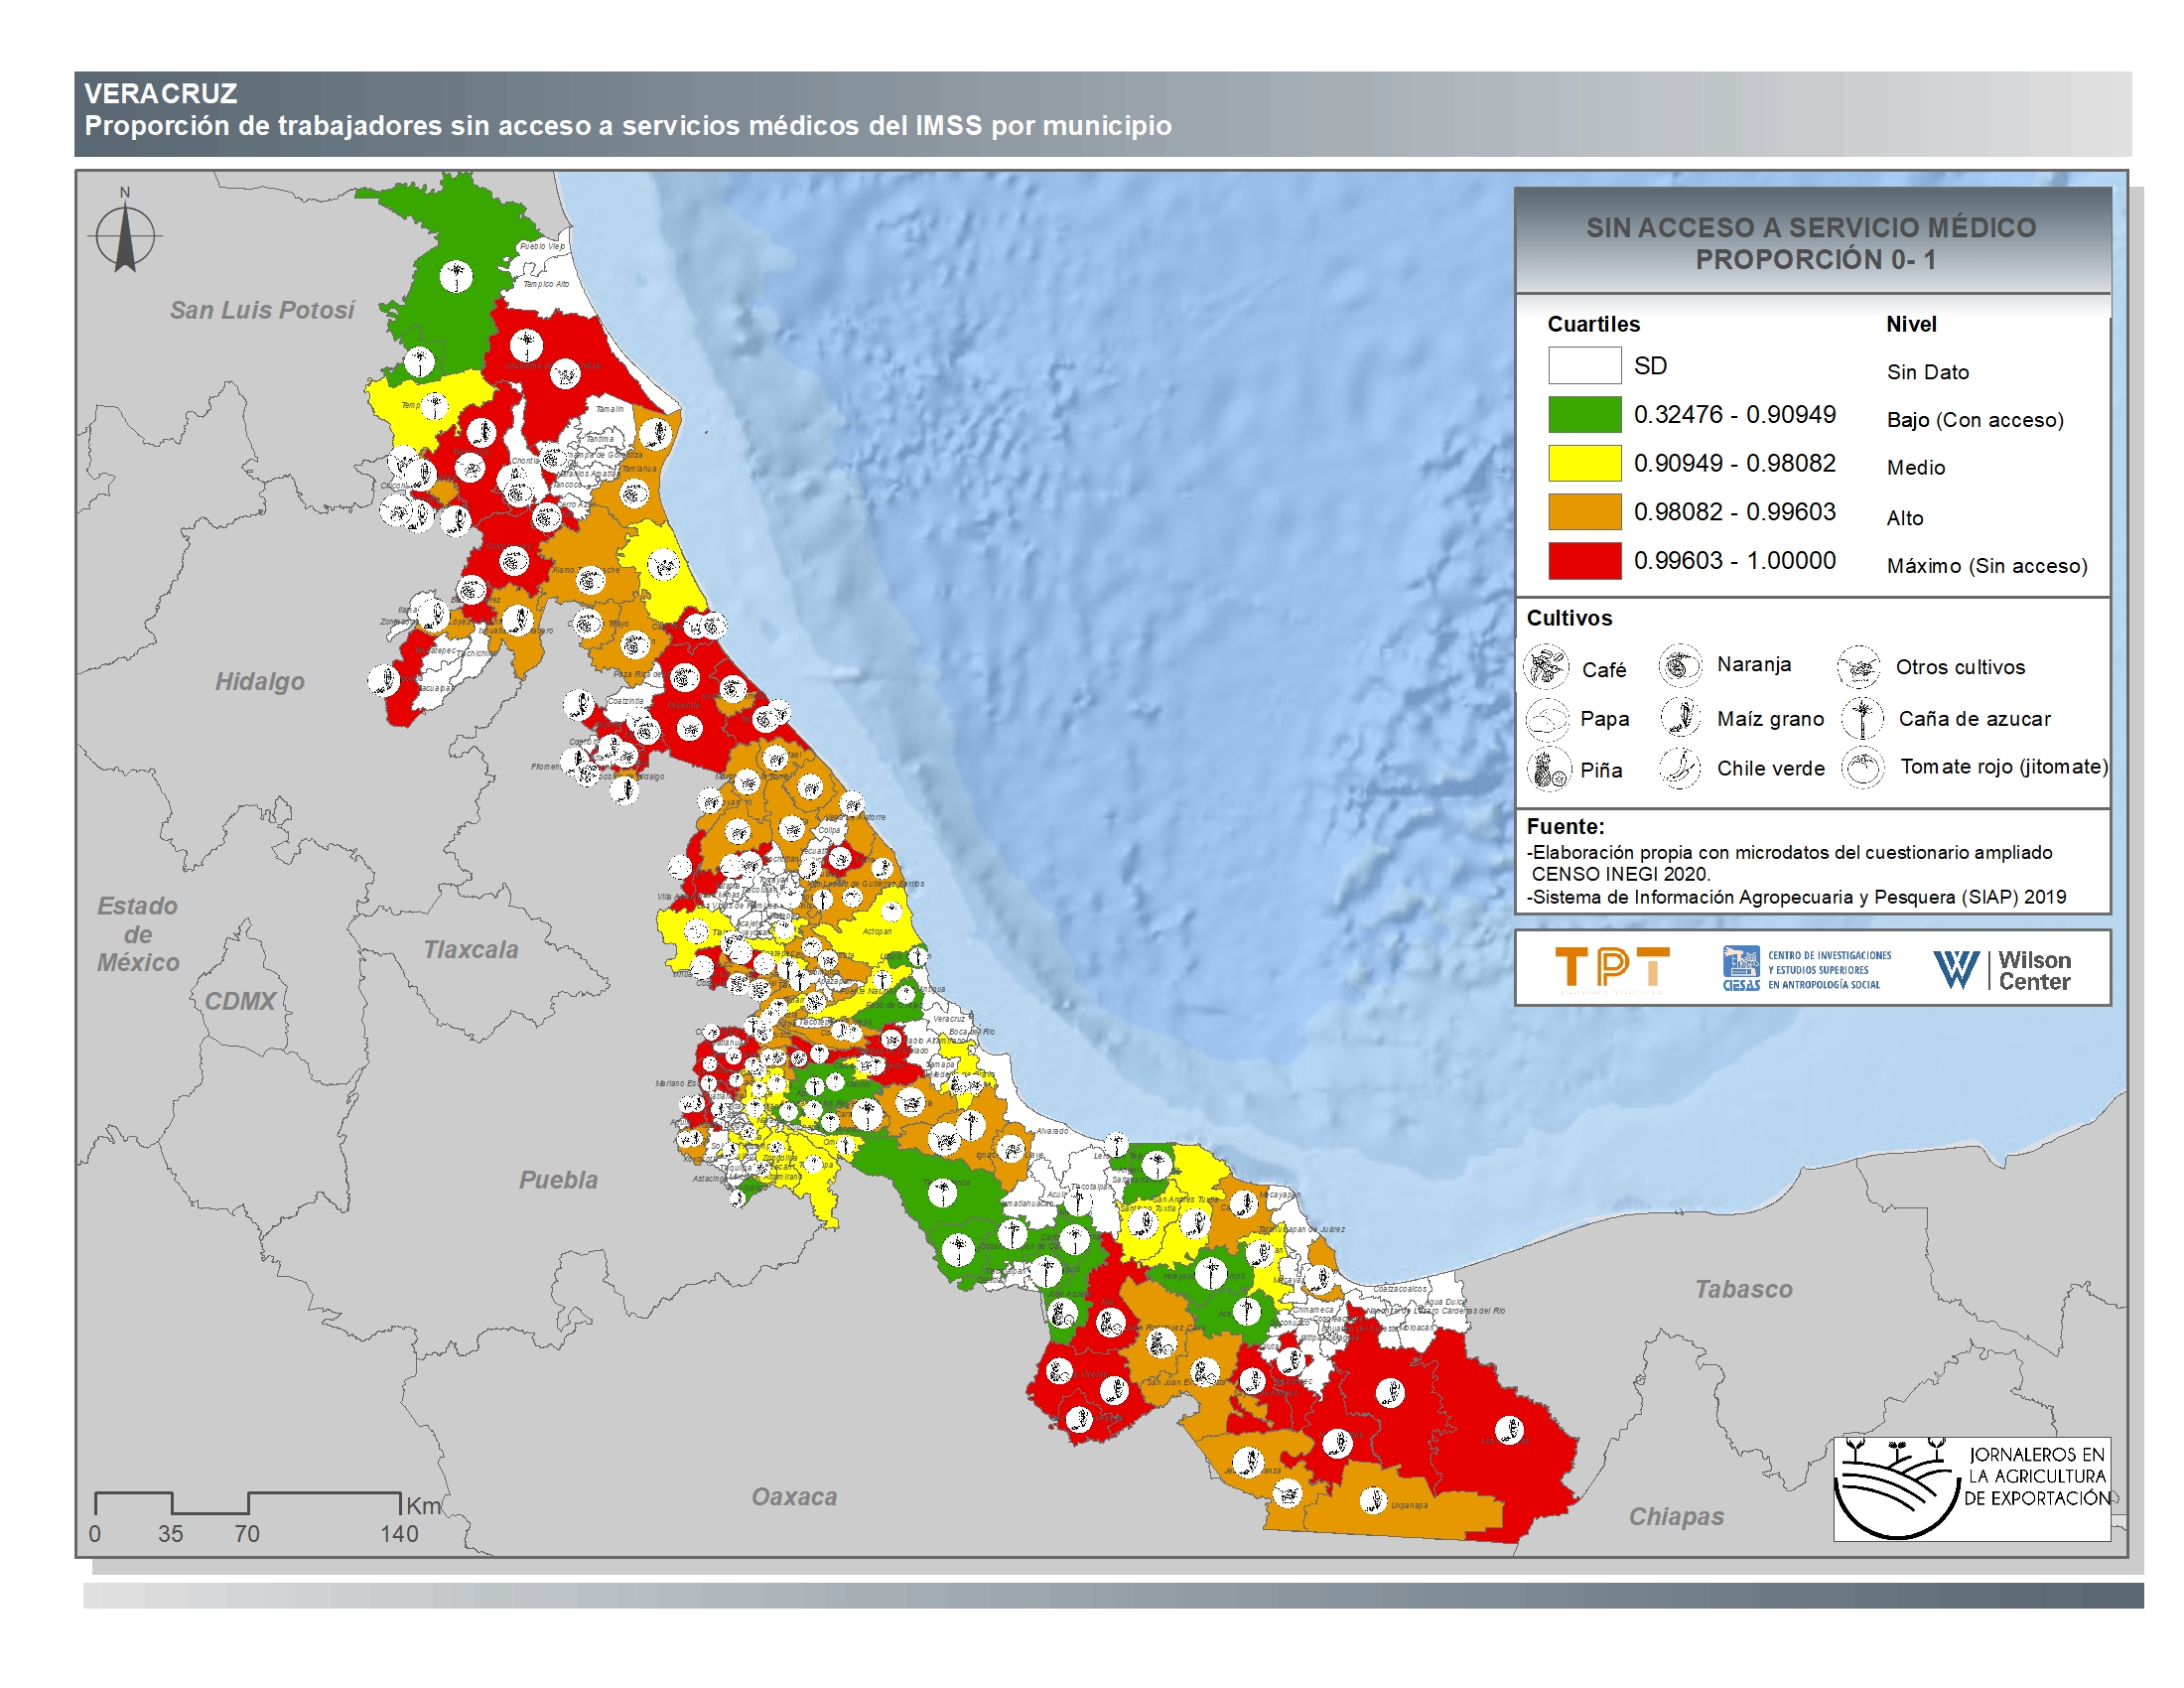
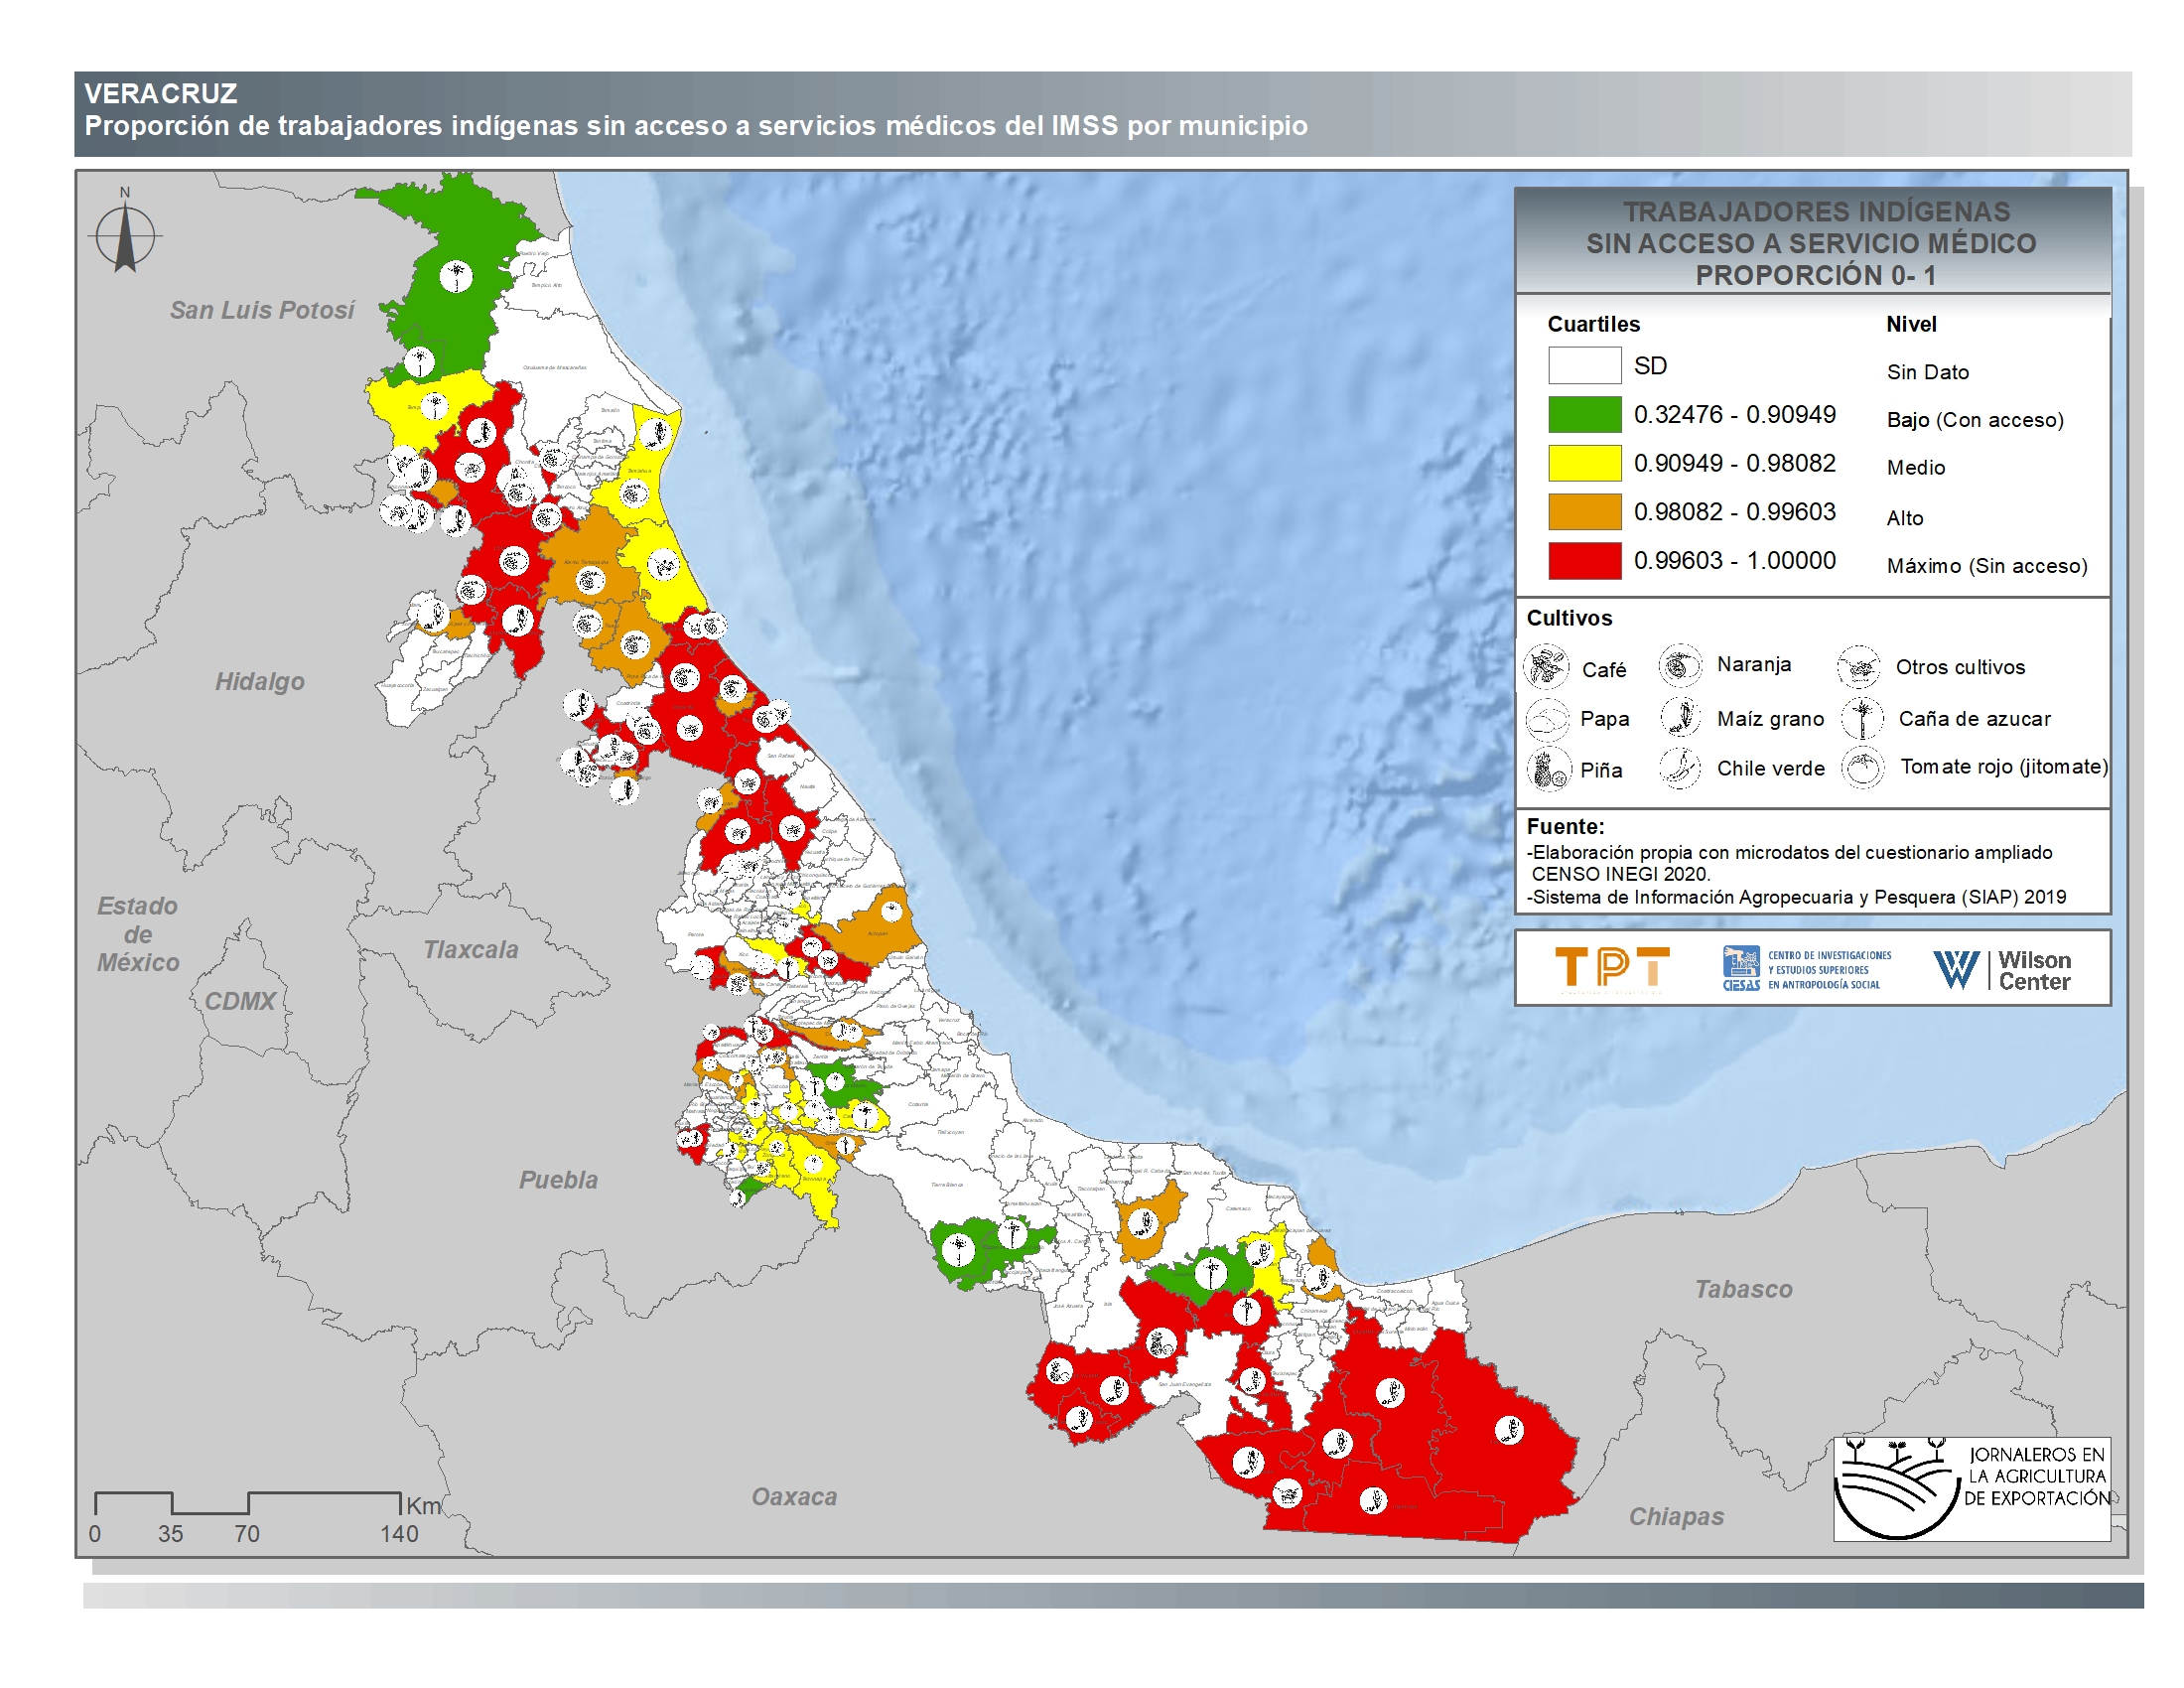
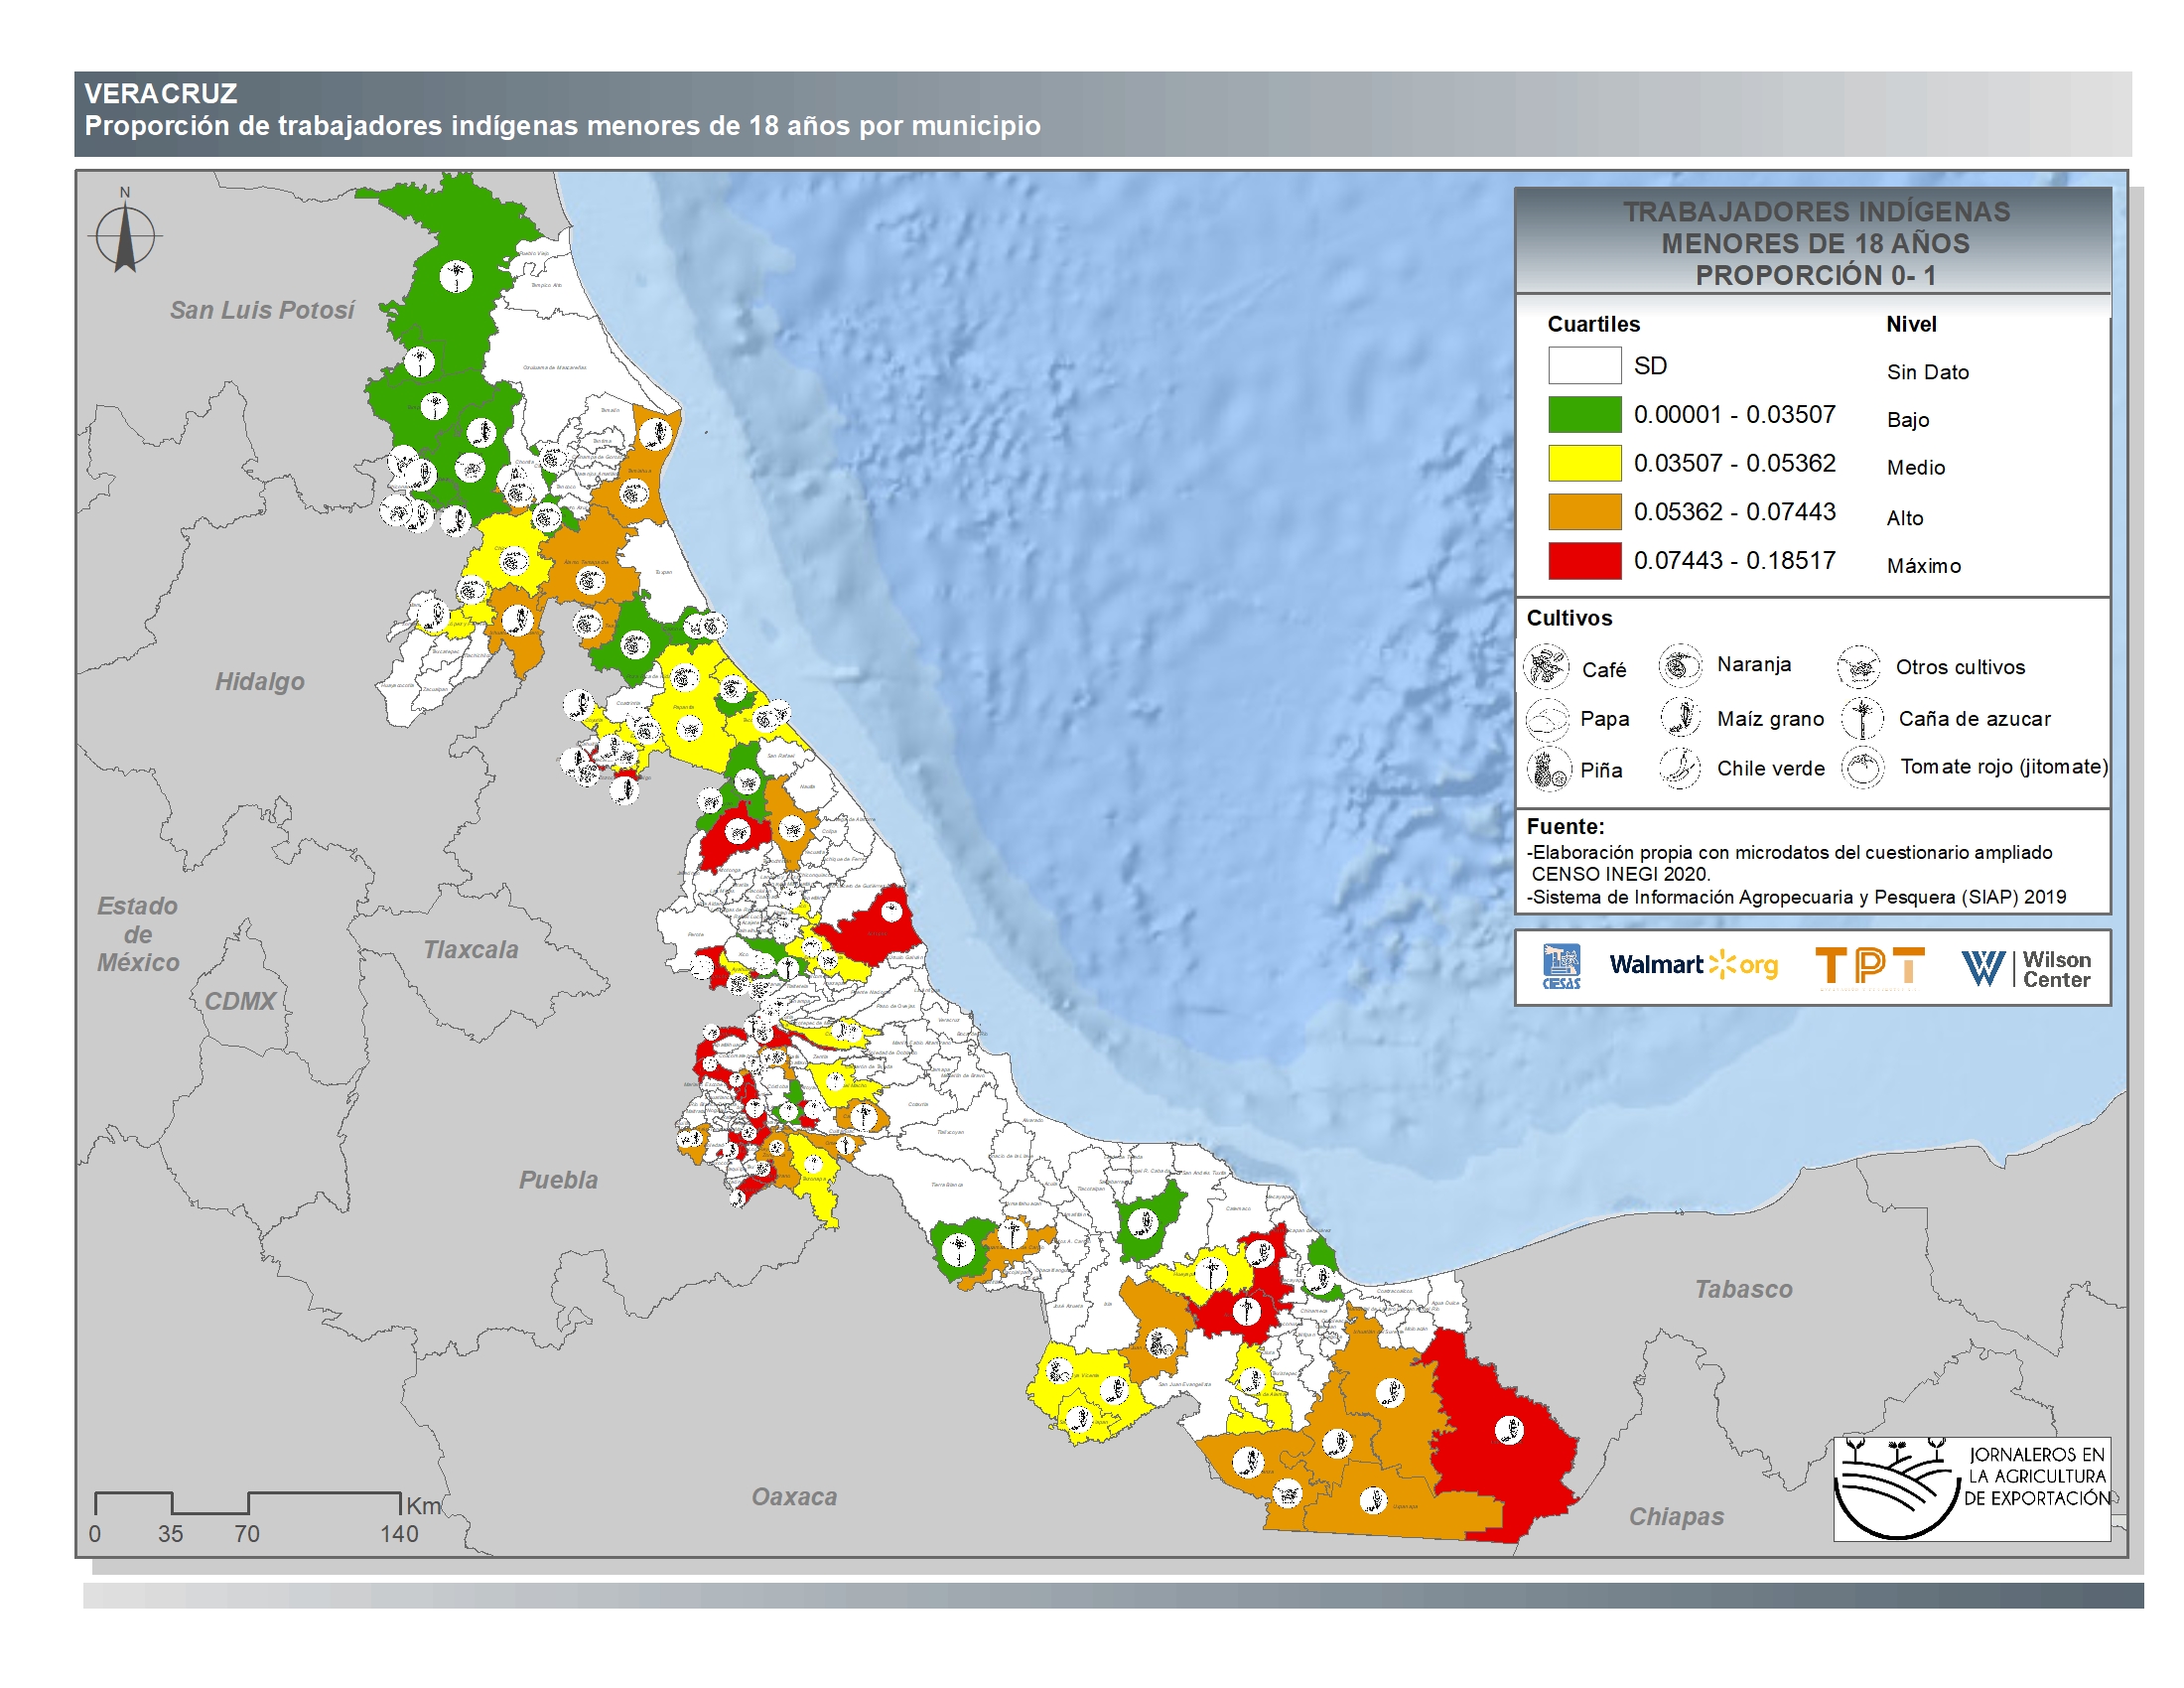
Veracruz
-
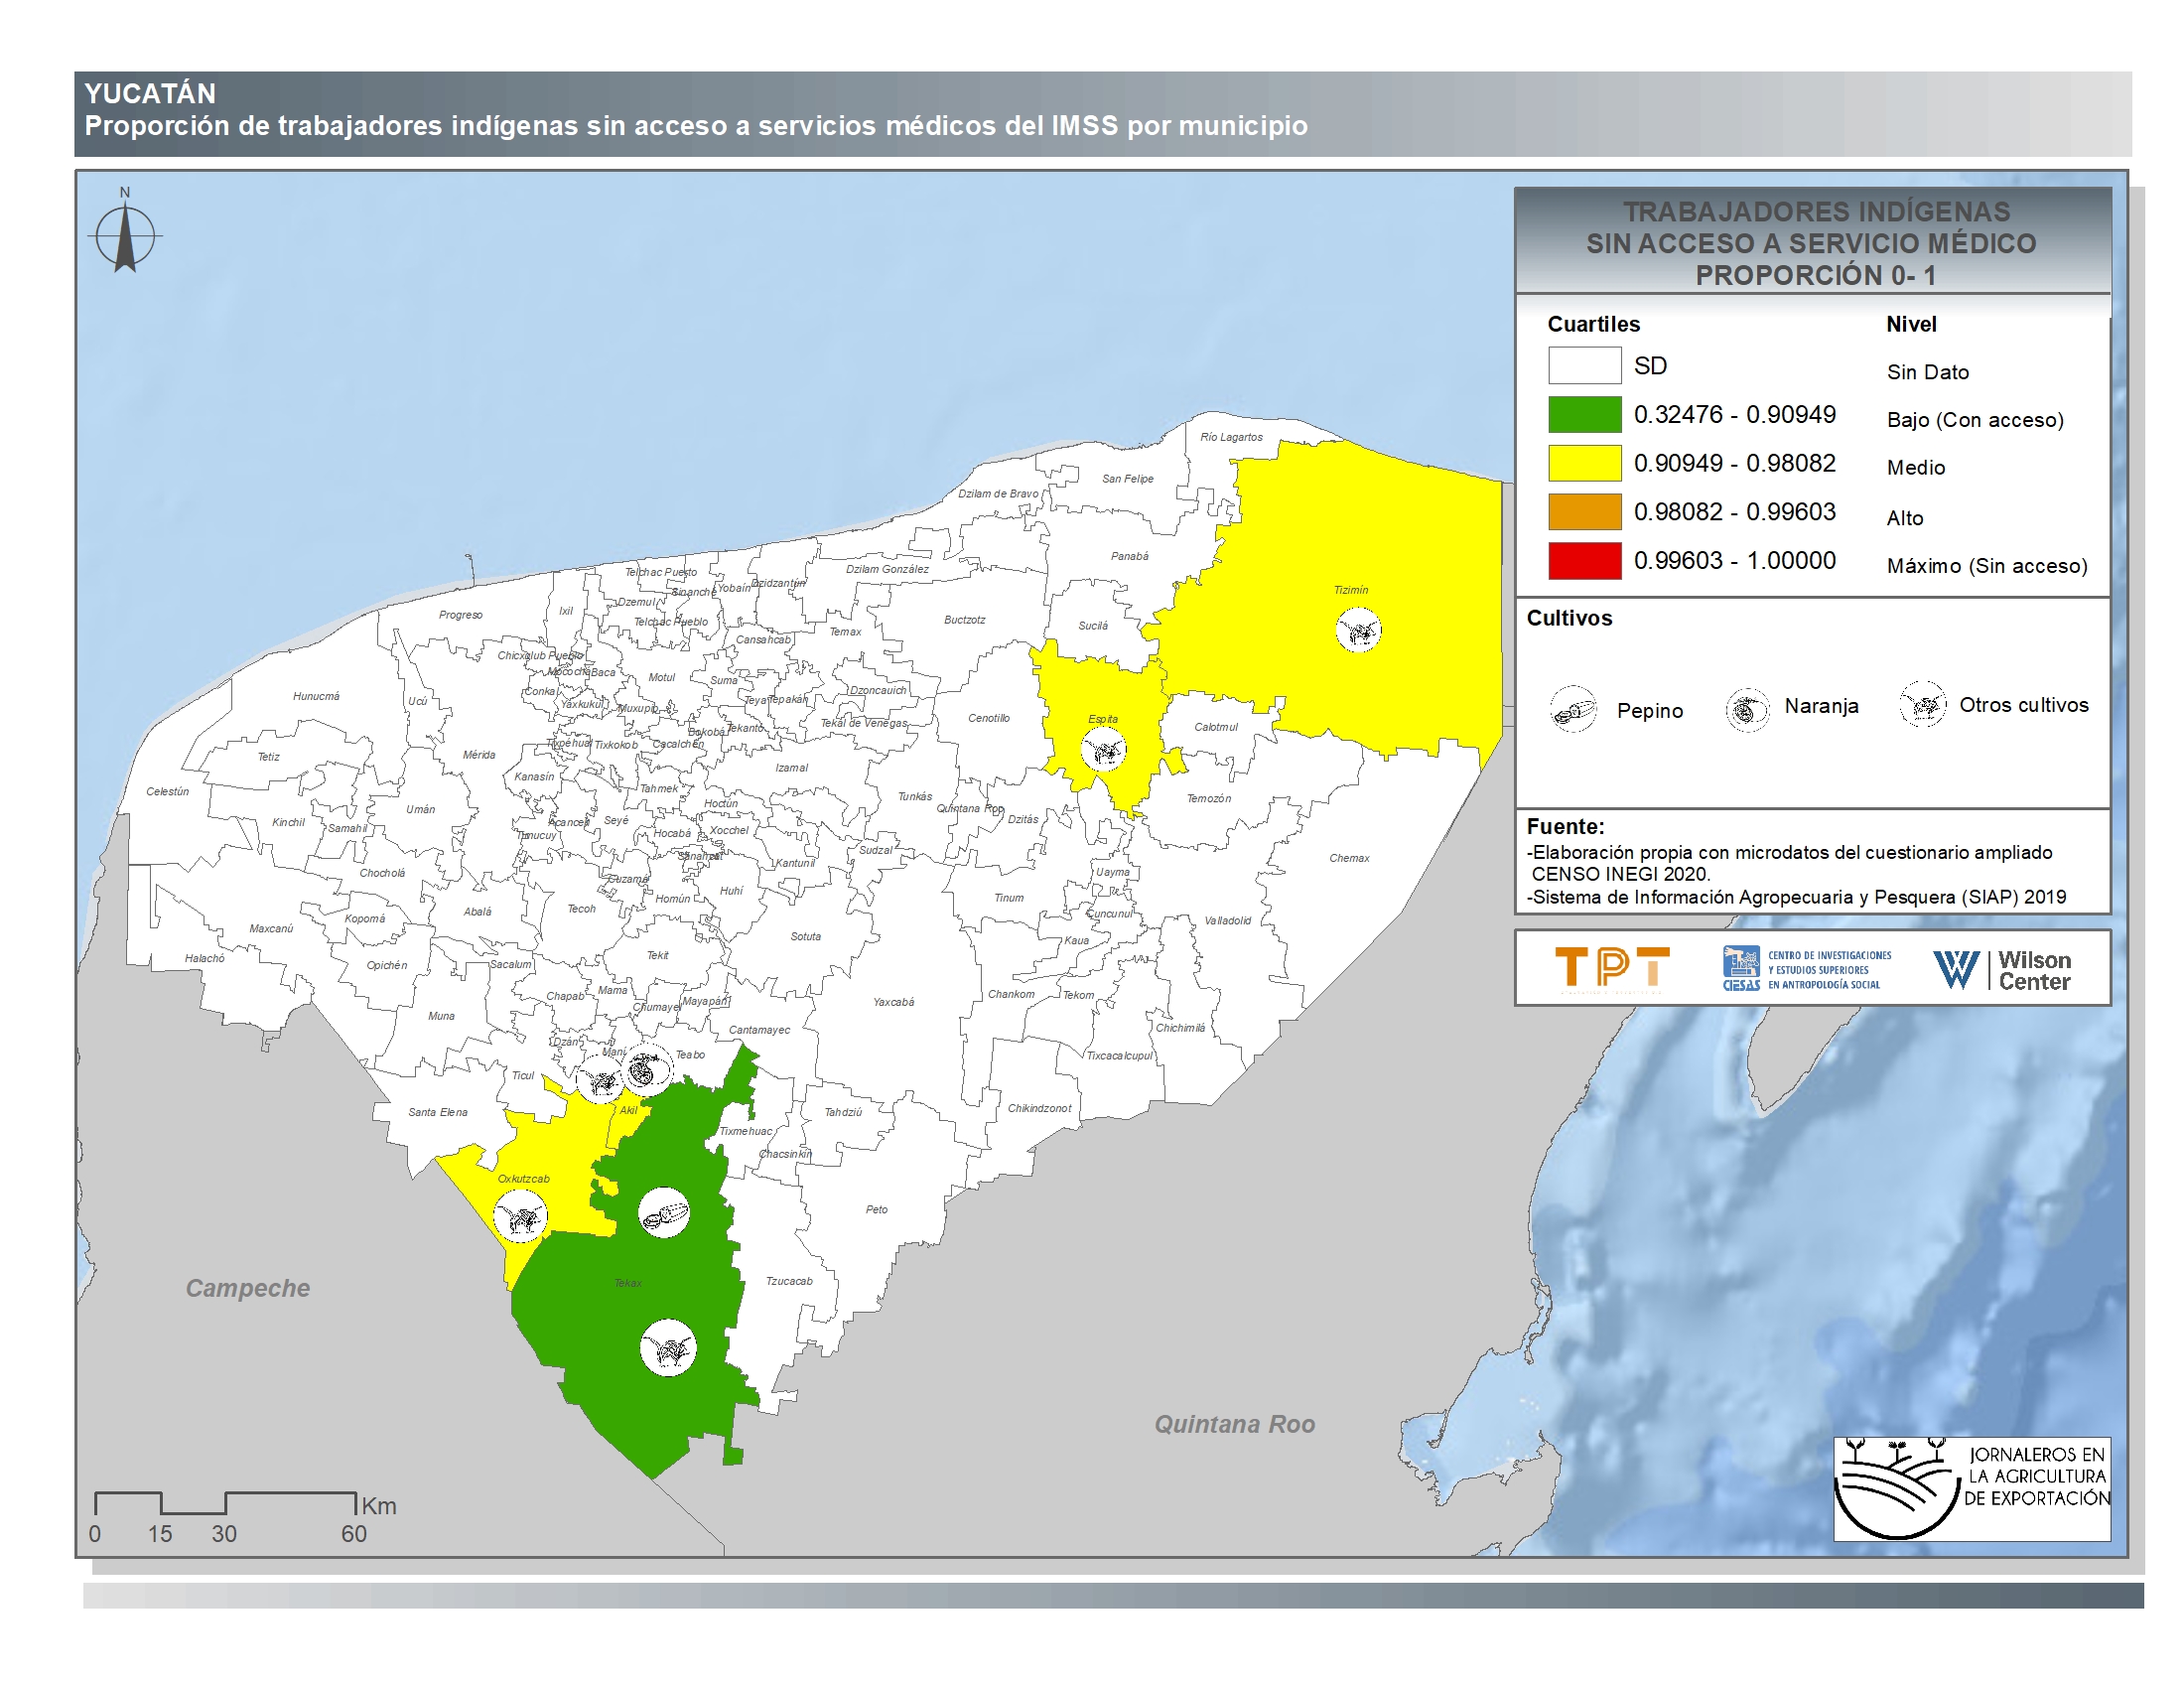
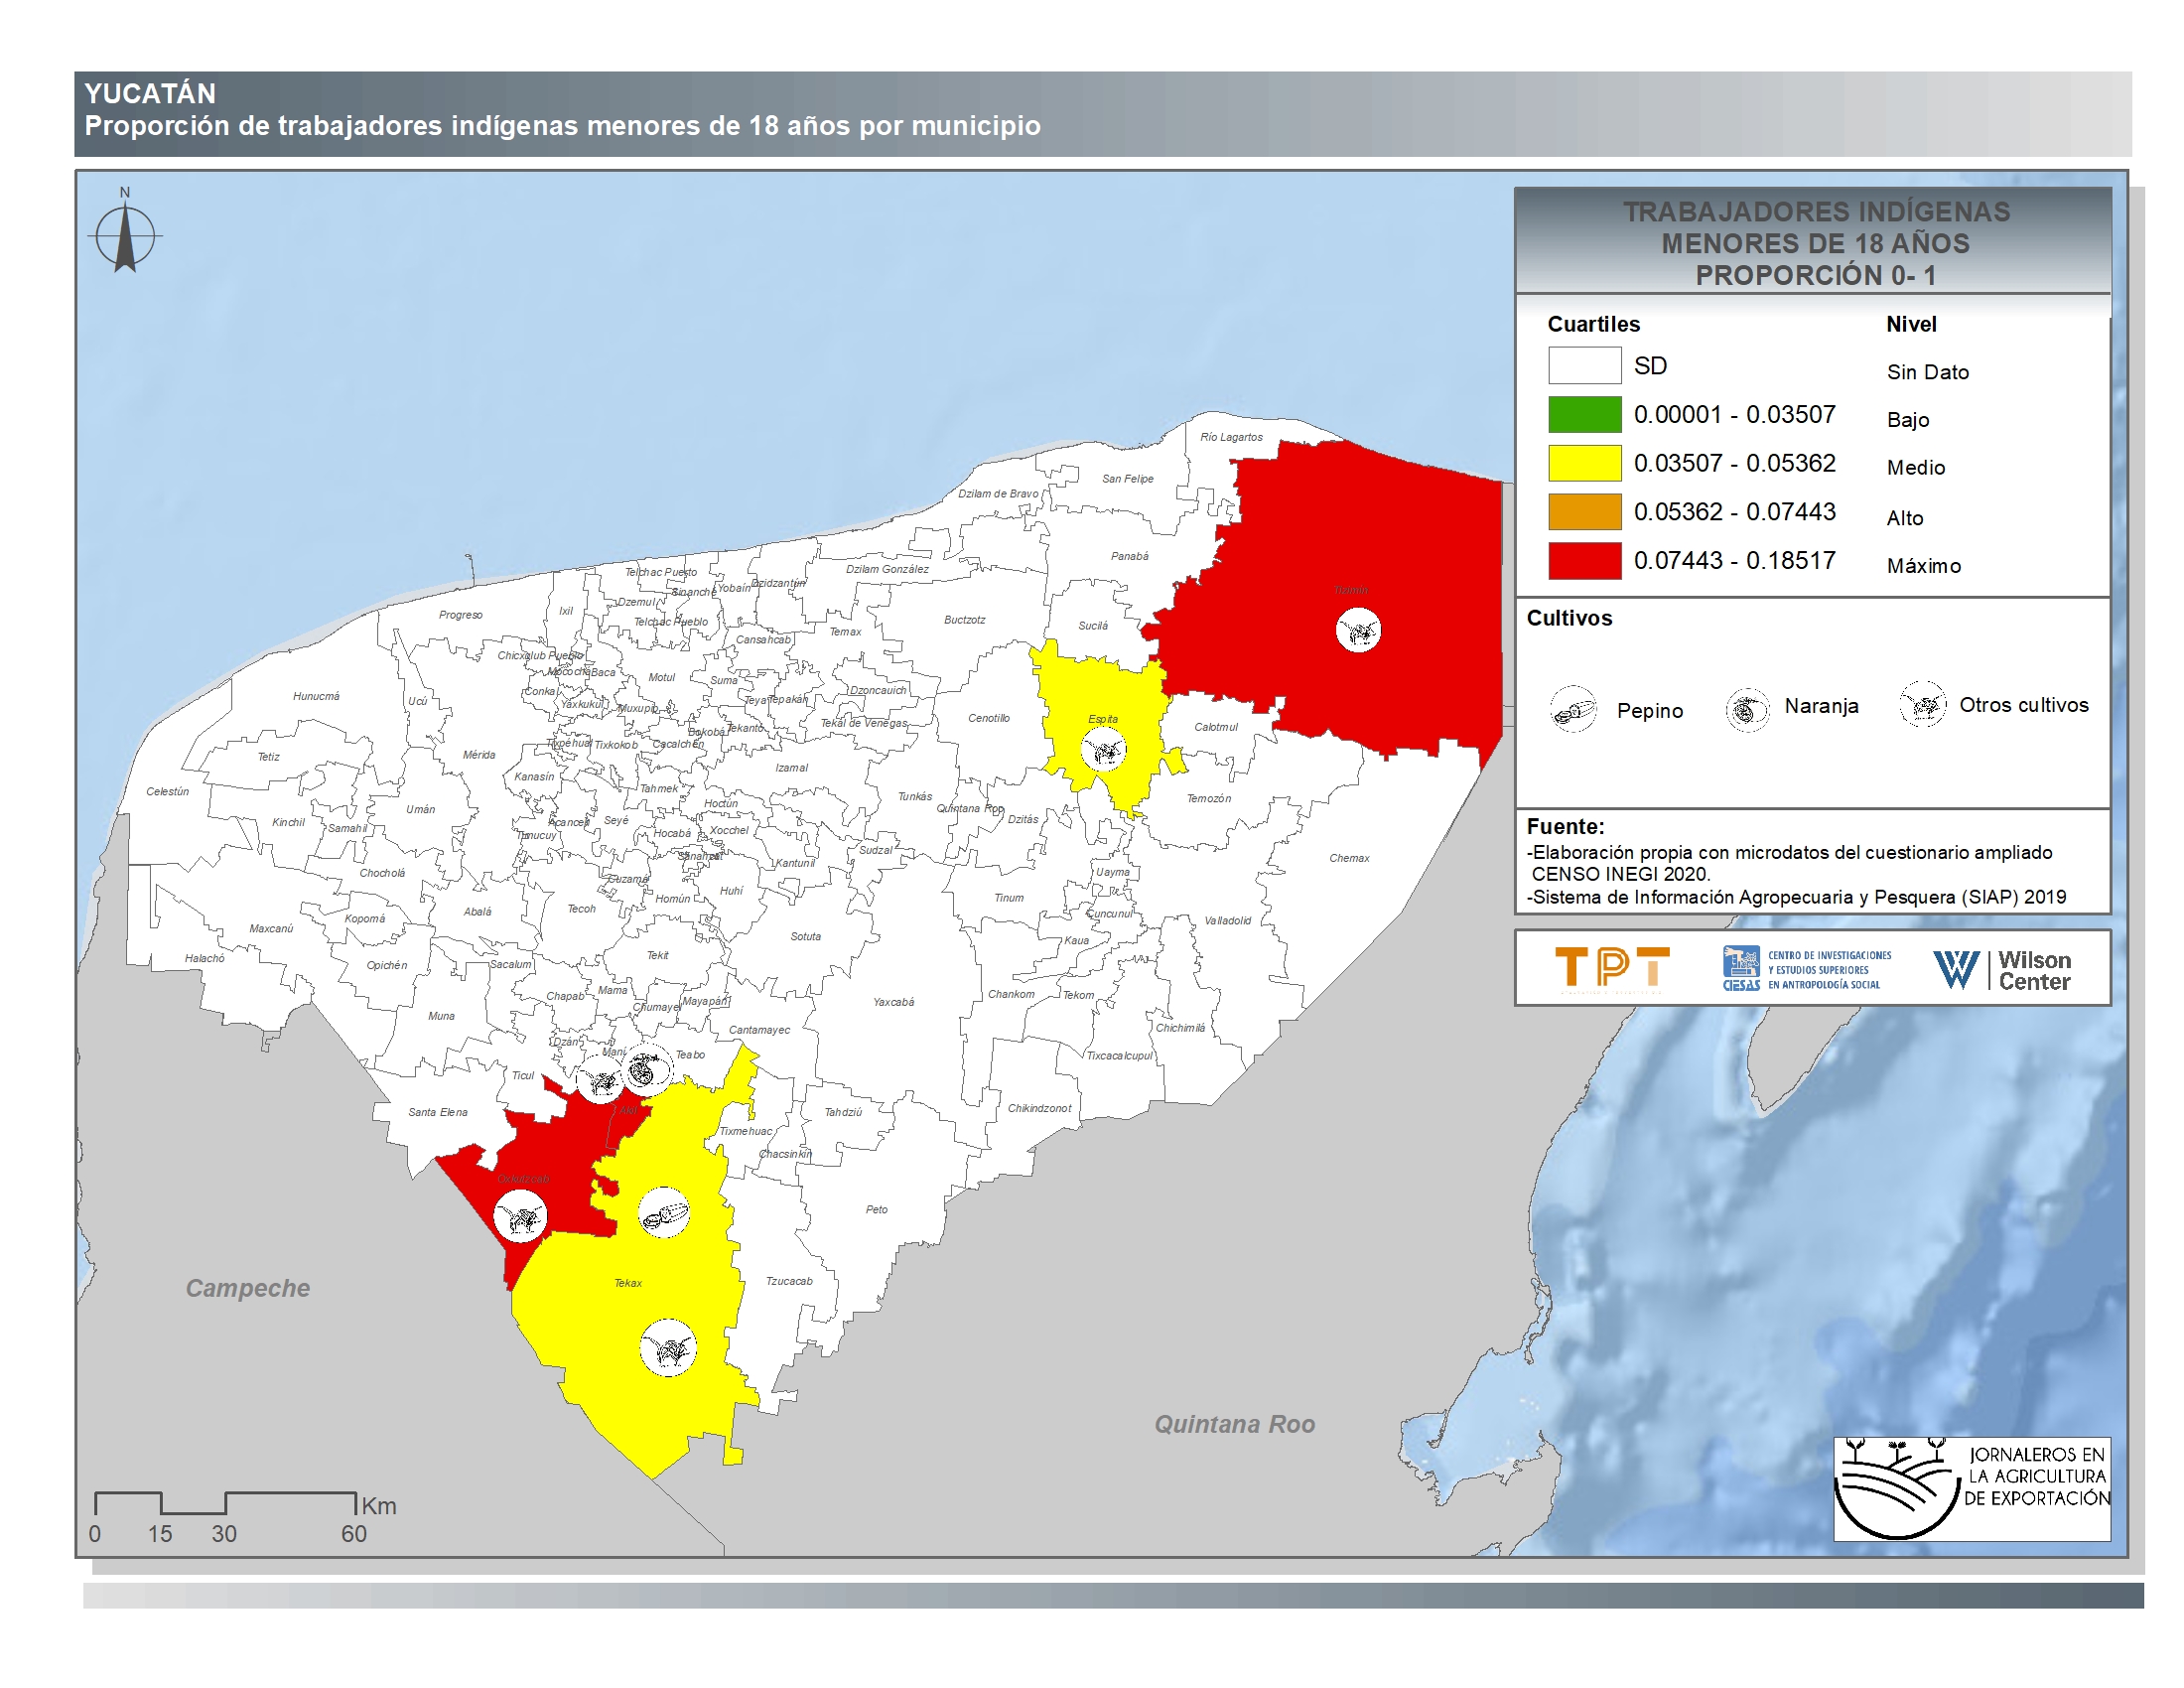
Yucatán
-
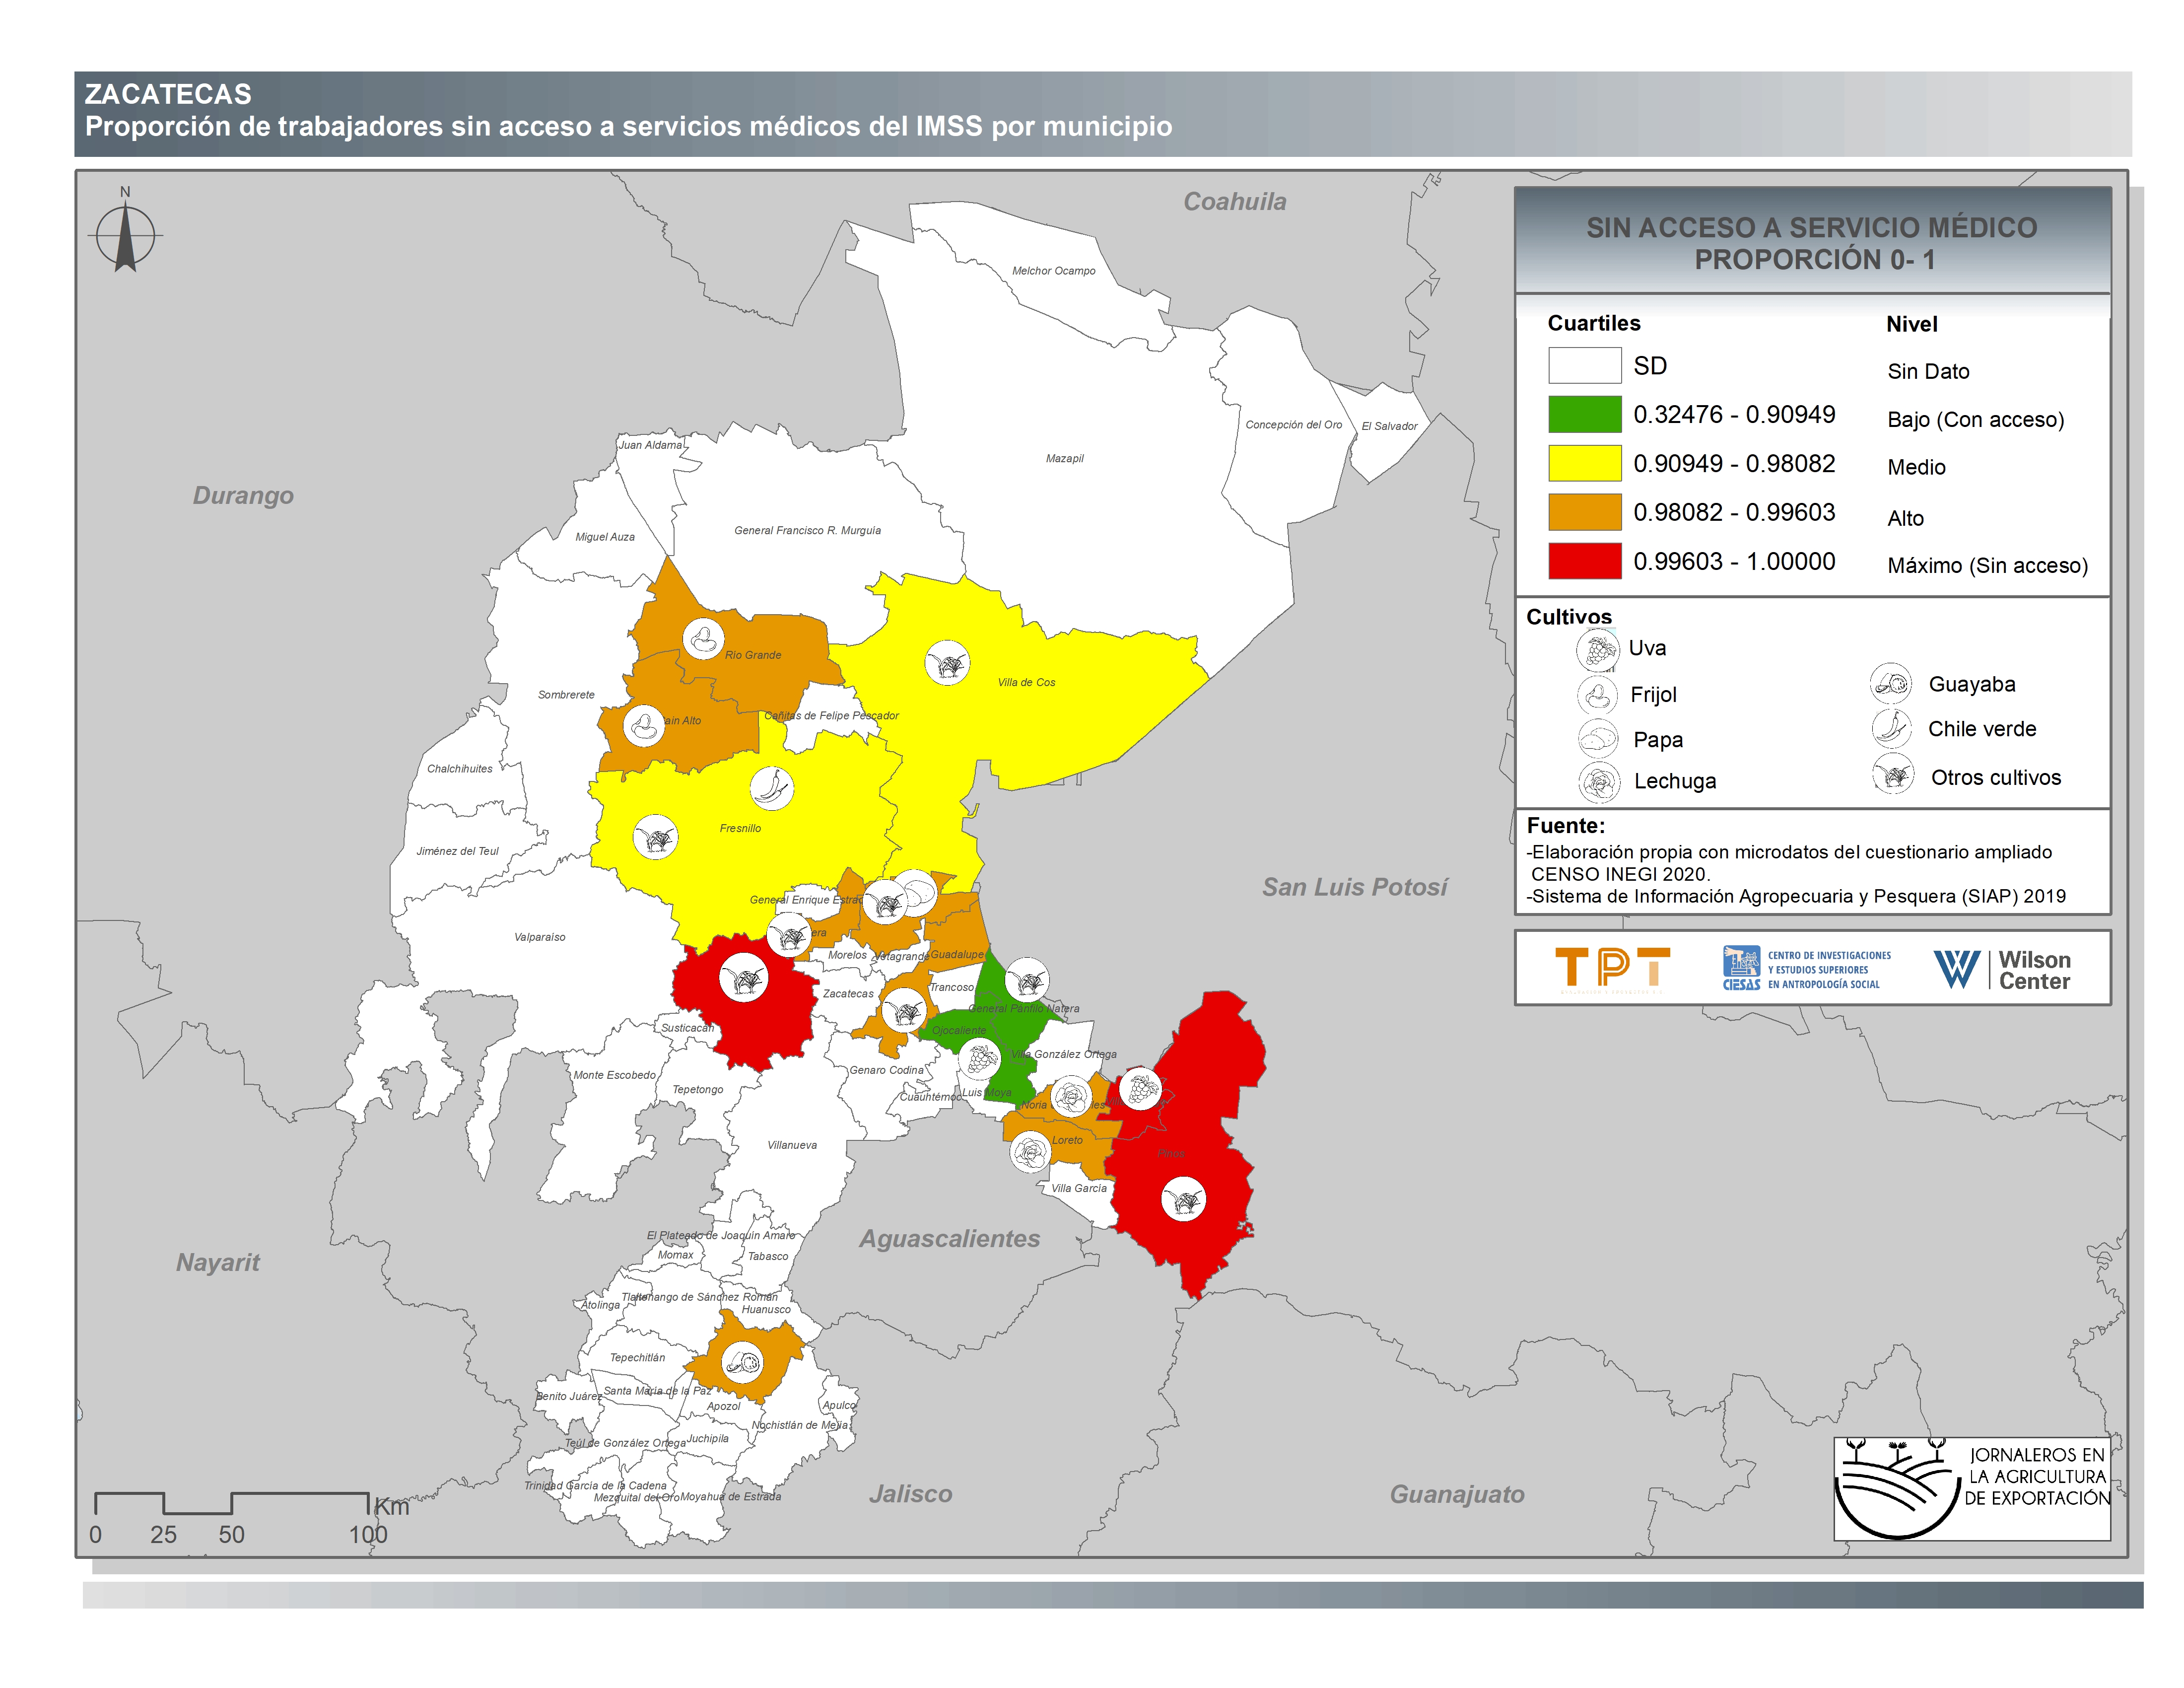
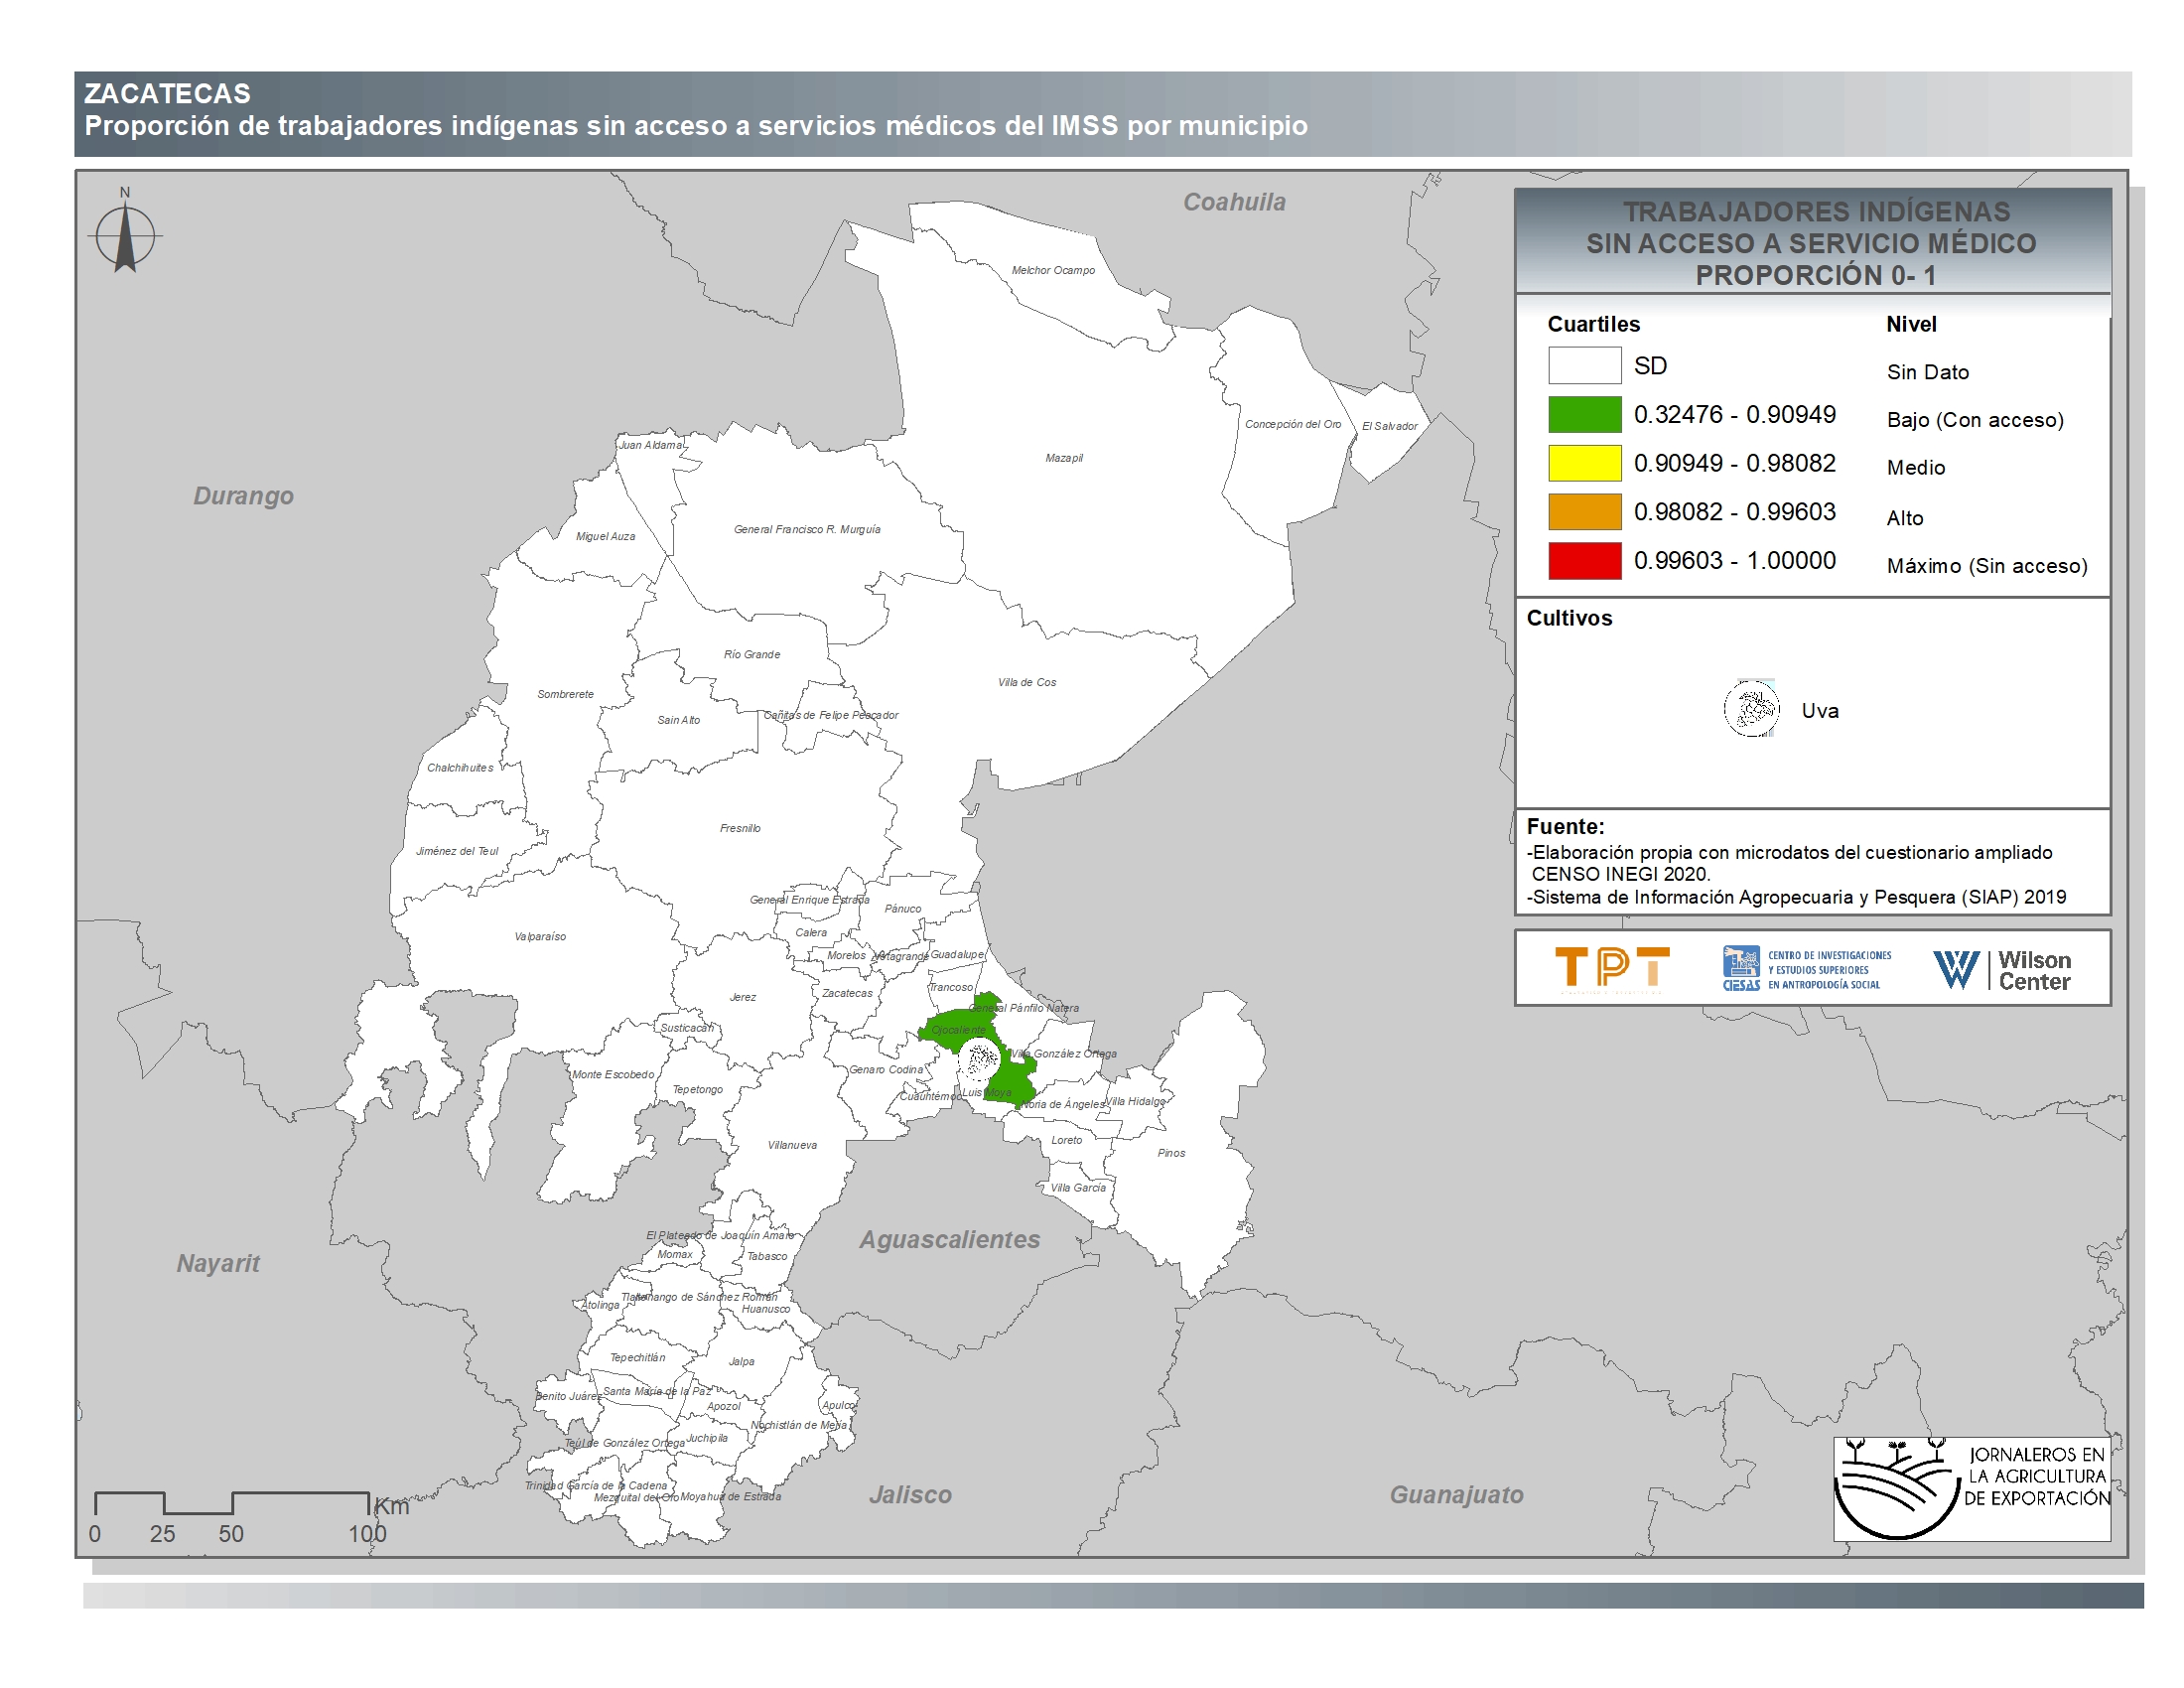
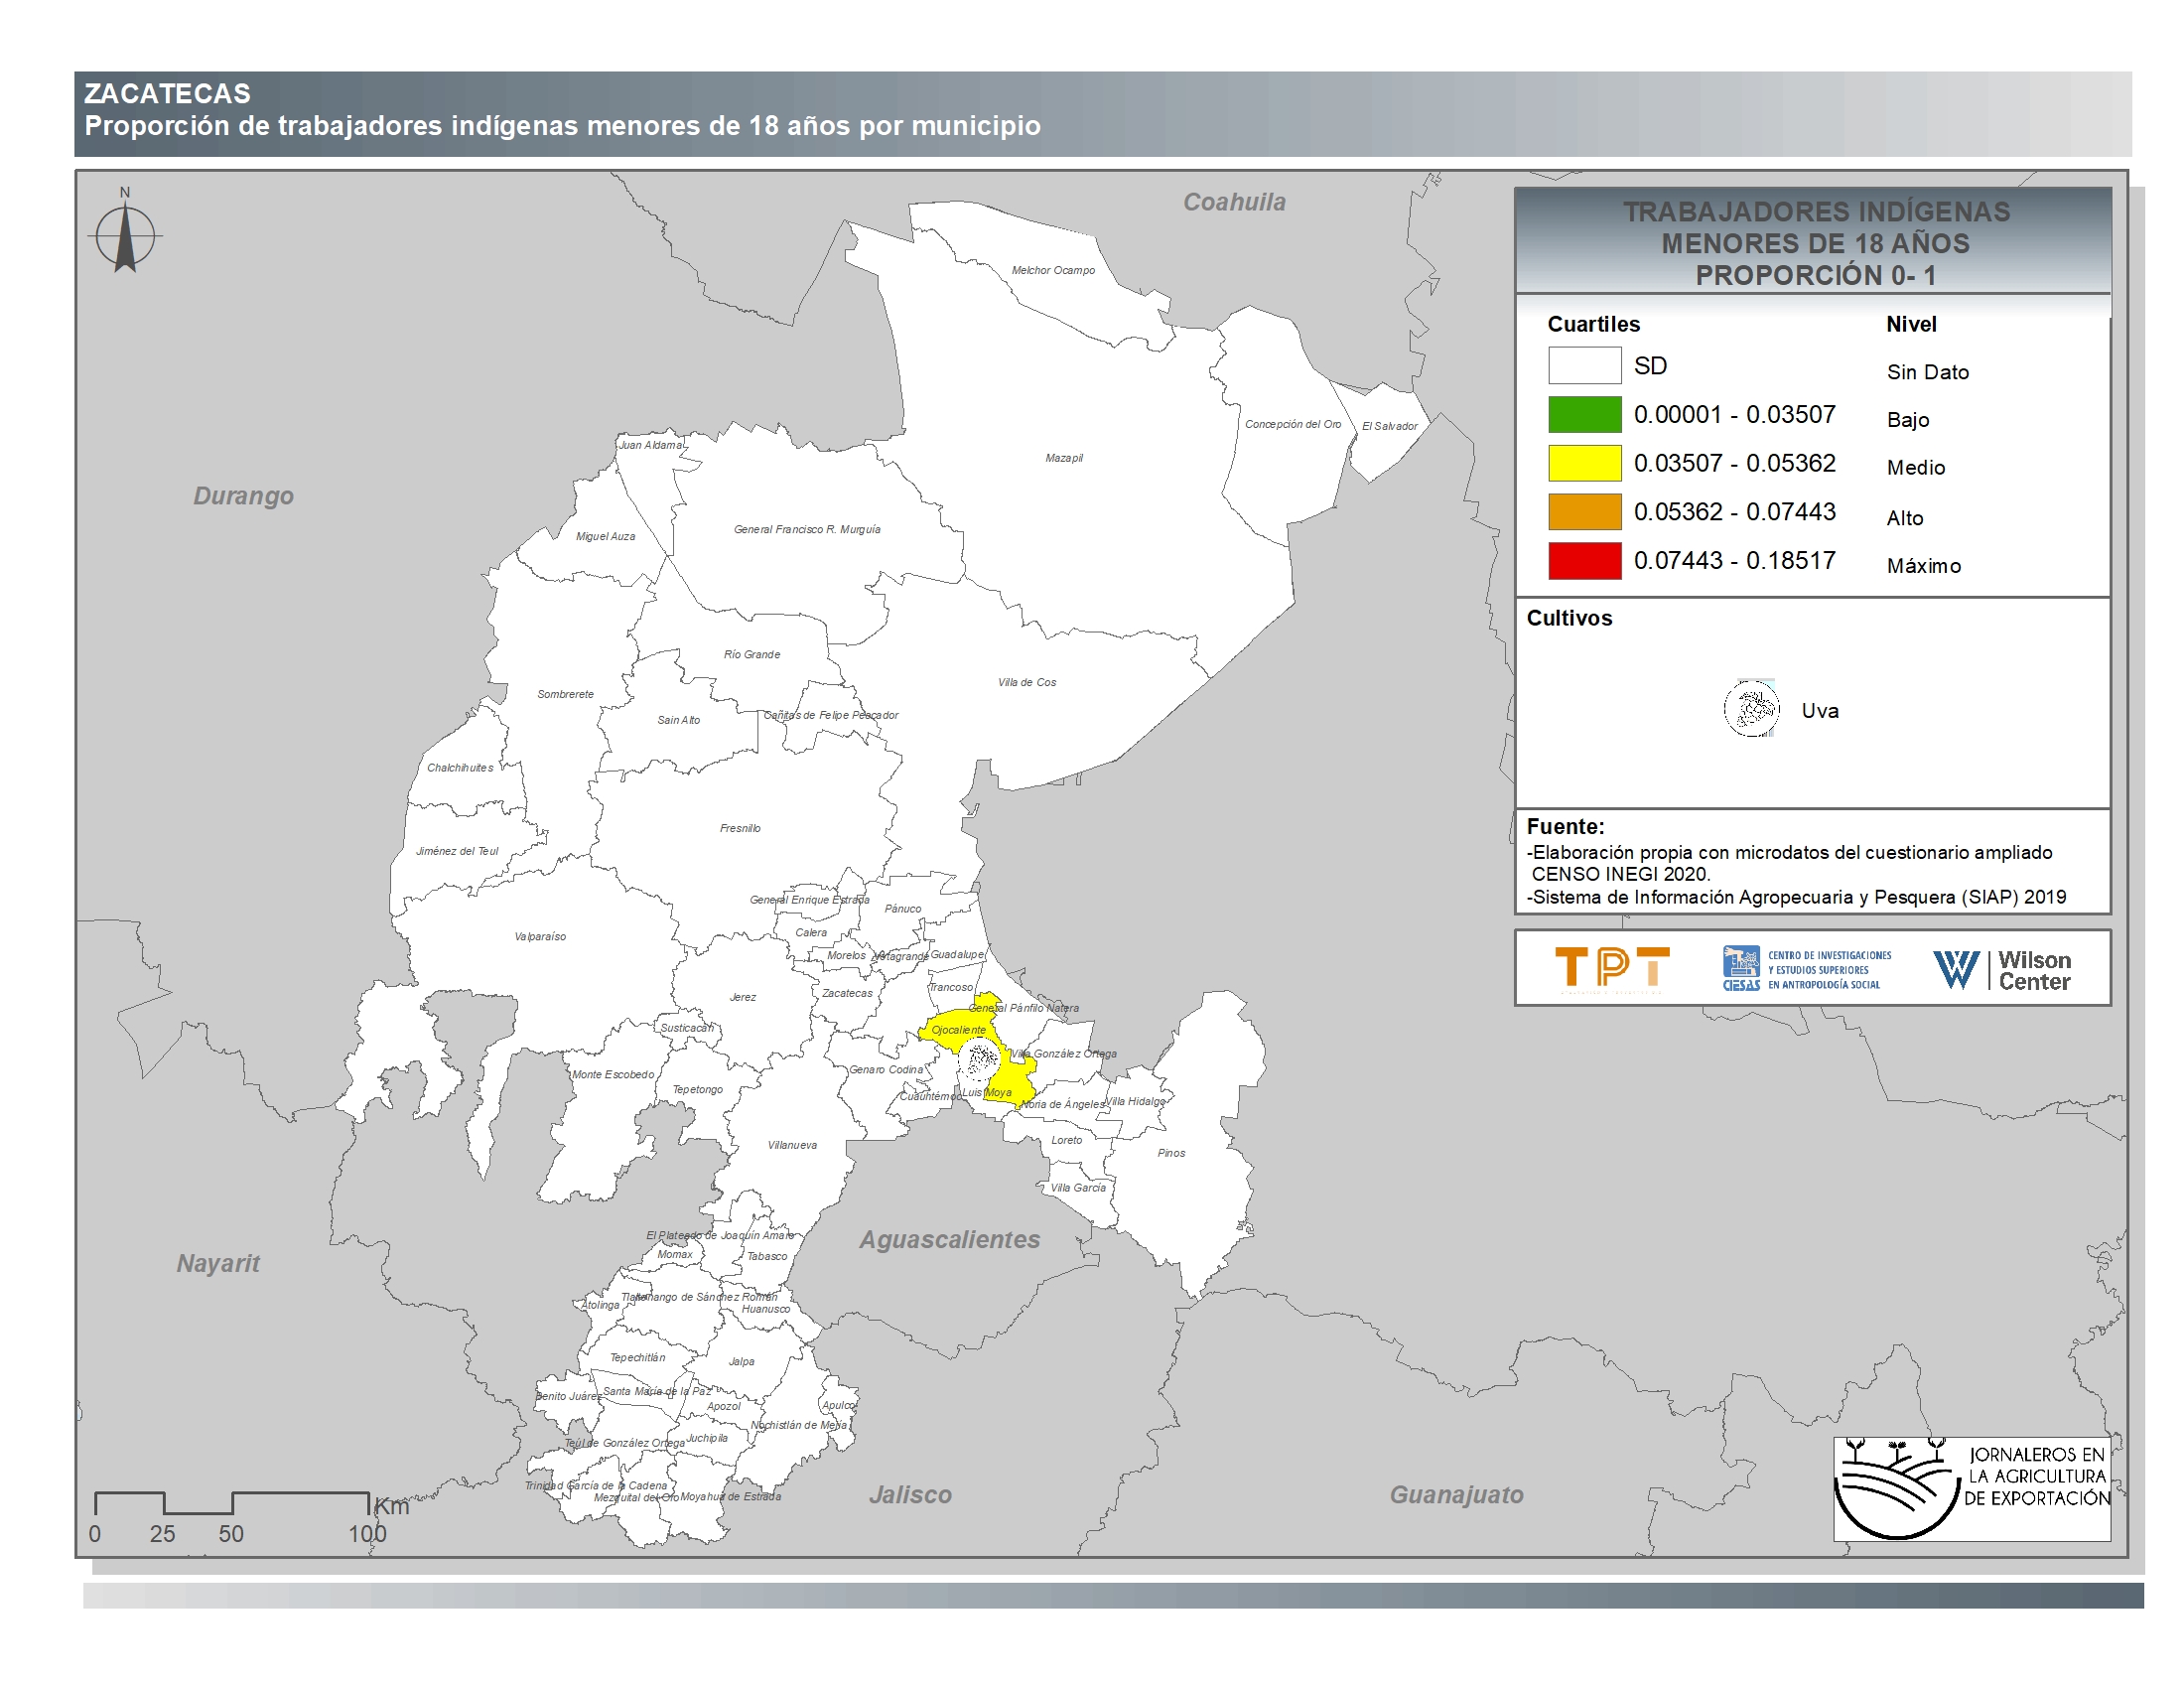
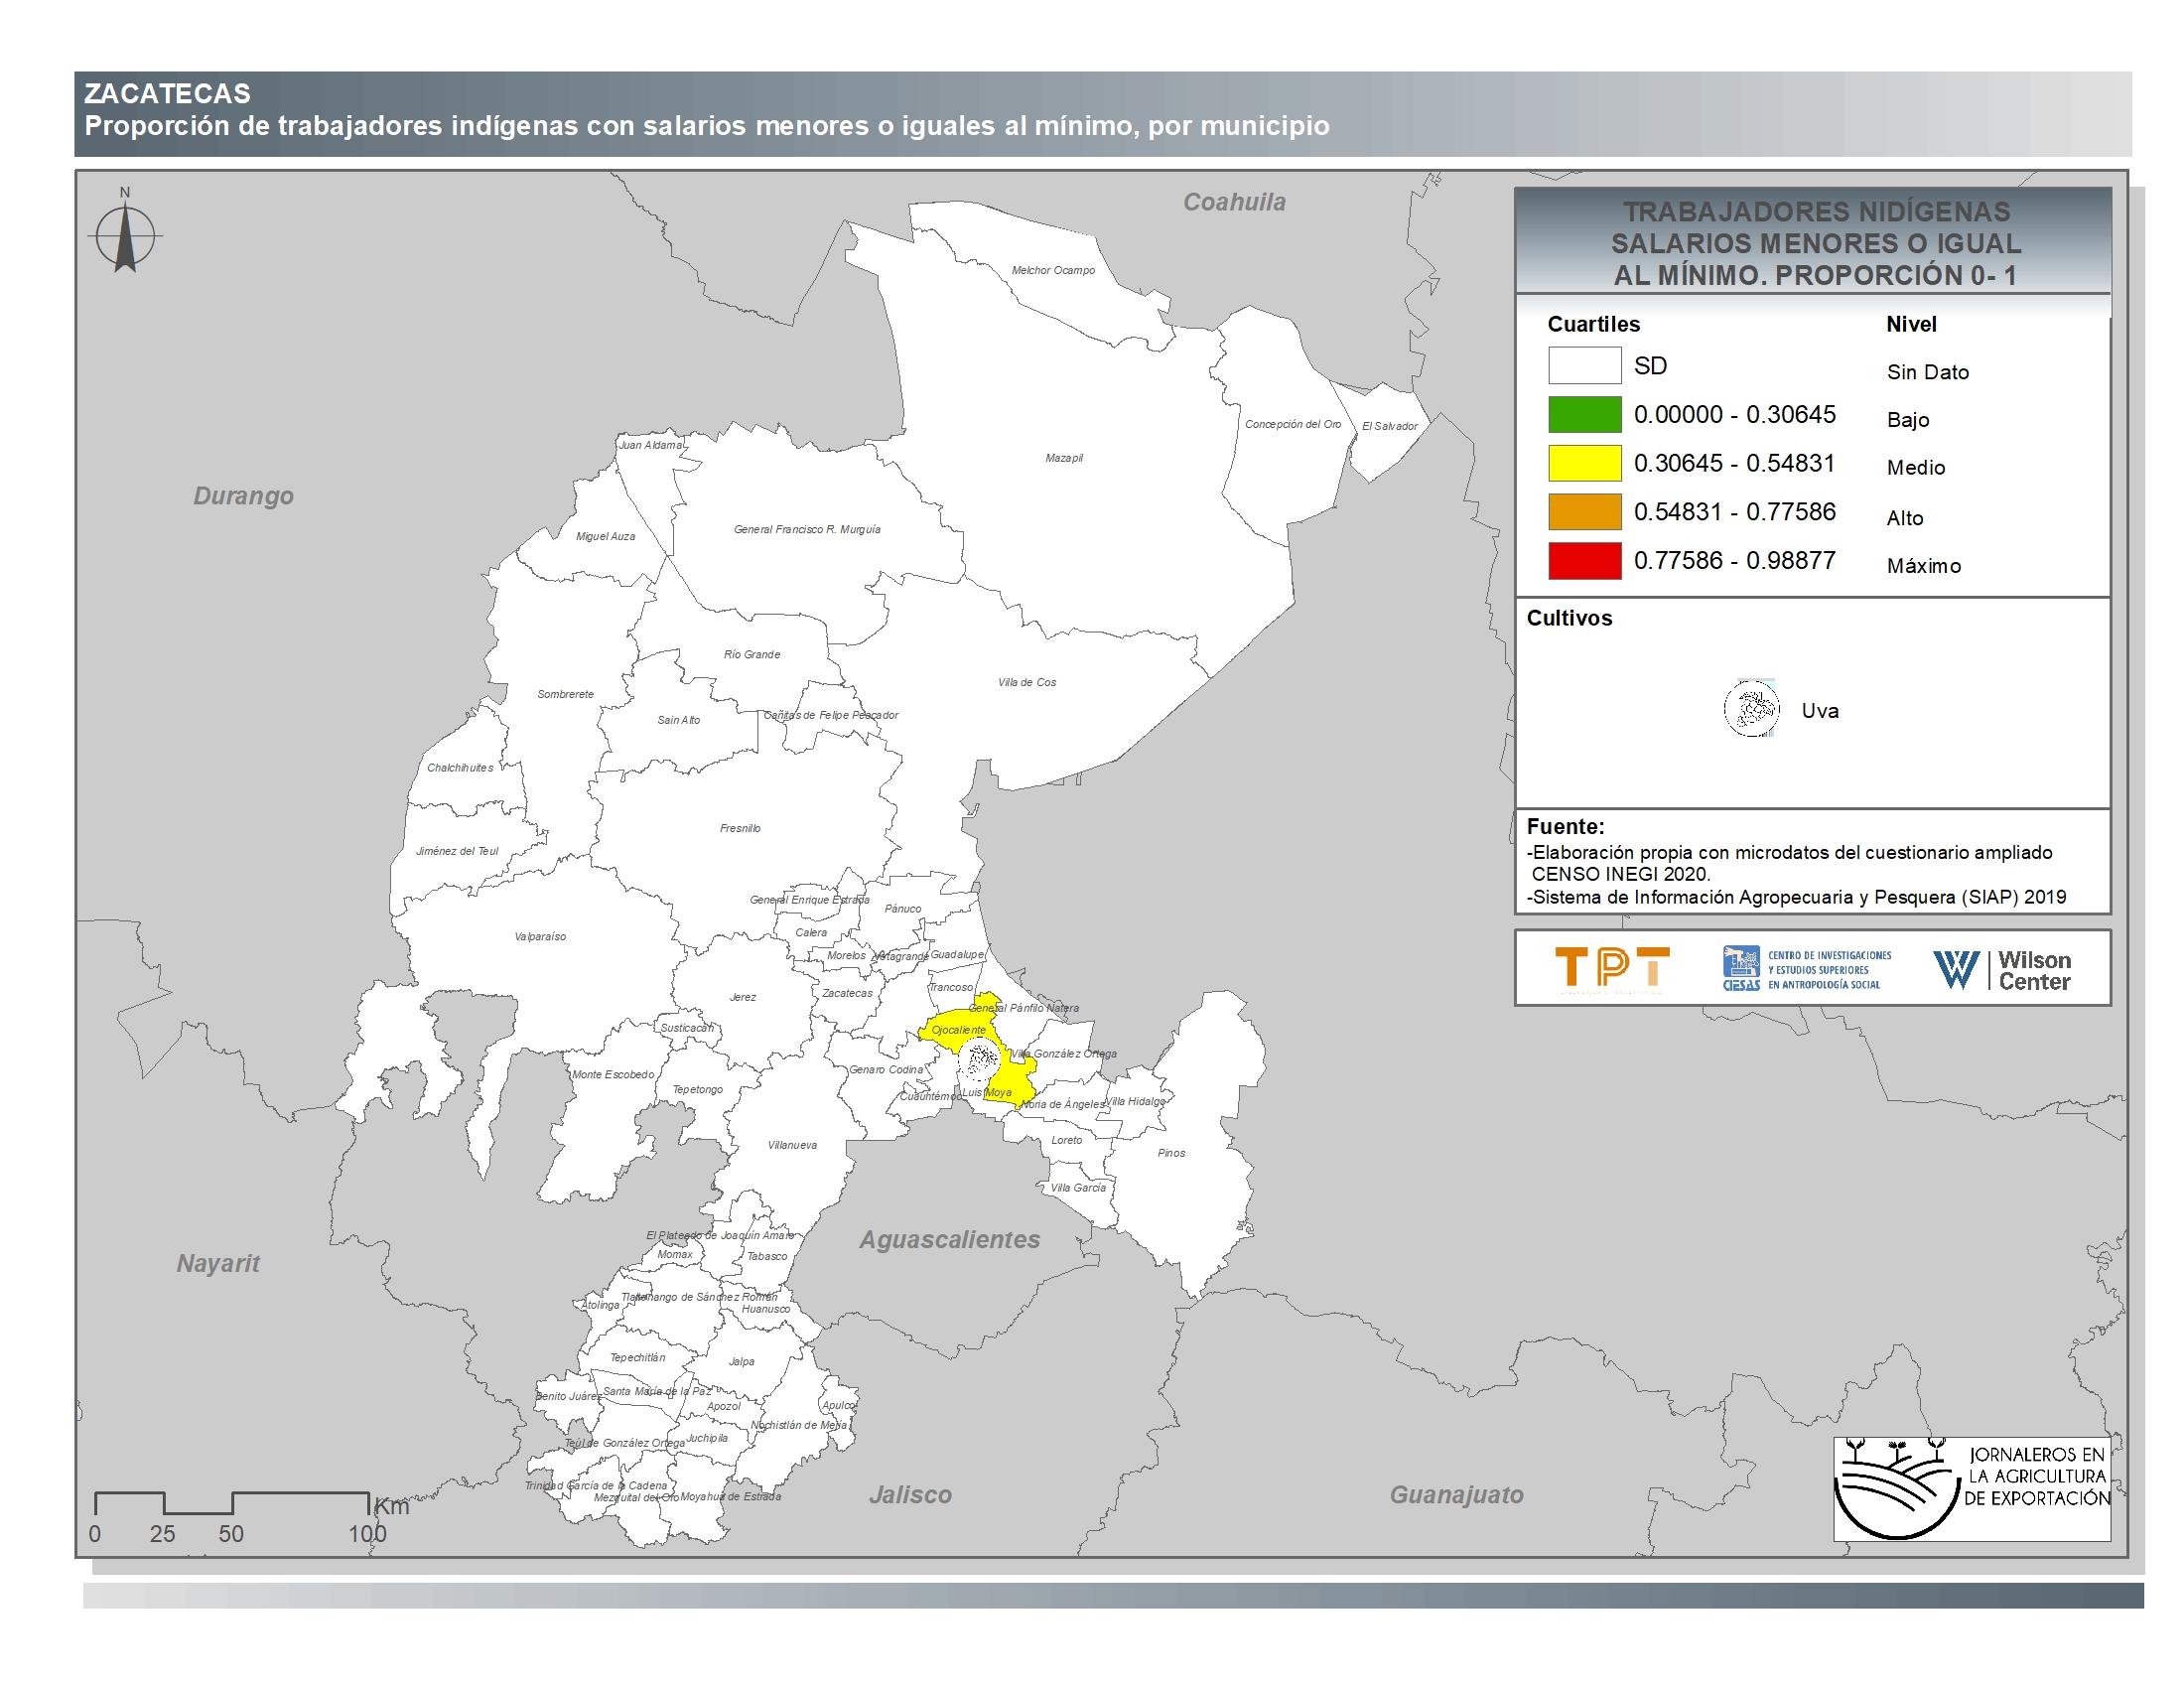
Zacatecas
Explore more related to this collection
5
results


