Just as the pause button was pushed on the tariff war between Canada and the US three weeks ago, the Canadian government released the first tranche of products targeted in its proposed retaliation. (At the time, Canadian officials indicated additional tariff and non-tariff measures could be deployed, depending on how the White House responds.) In any event, with US tariffs on hold until March, Canadian retaliation is likewise paused. But given the mercurial nature of the Trump administration’s decision making, the current hiatus may prove to be temporary and it is useful to look at the numbers behind the Canadian response.
To assess the potential impact of Canadian retaliation, AI was used to identify which states would be most affected by the proposed Canadian tariffs. The total number of tariff “hits,” instances in which a particular state was identified as likely to be adversely affected by a proposed retaliatory tariff, are presented below (chart 1). It is important to emphasize that these results do not reflect a comprehensive assessment of each and every tariff line in the proposed Canadian retaliation. In this respect, the results below reflect broad categories of goods and products (Table 1) and should thus be considered an unscientific sampling rather than a census of possible effects. Moreover, the results here are subject to the limitations of still nascent AI, which developers are quick to point out is still under development. Accordingly, the actual incidence of tariff “hits” for any particular state could be different, possibly significantly different from these figures.
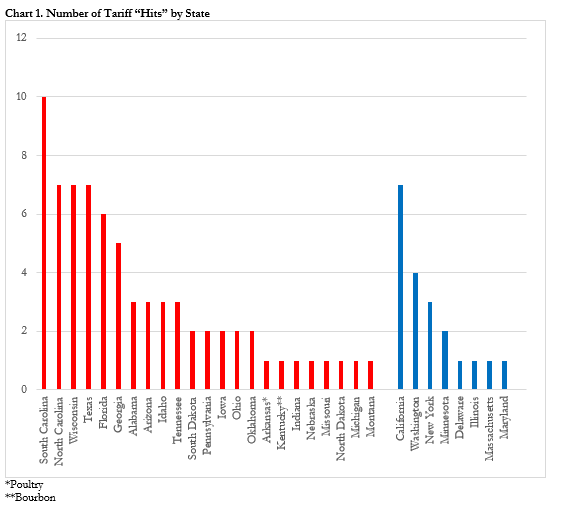
With this caveat, three observations stand out. First, a wide swath of states would be affected by Canadian tariff retaliation (chart 1). Once again, note that these results are only suggestive and neither a definitive nor decisive analysis of the incidence of possible retaliation. There may well be other states potentially affected by proposed Canadian retaliation but which failed to meet “the most affected” threshold.
Second, while both “red” and “blue” states — sorted by the 2024 presidential election results — are affected, roughly three times as many red states appear to be exposed to the proposed Canadian retaliation. Given this difference, it is not surprising that red states combined have a much higher total number of tariff “hits” (chart 2)[1]. Based on these numbers, it would appear that the proposed Canadian retaliation is focused on Trump’s electoral base.
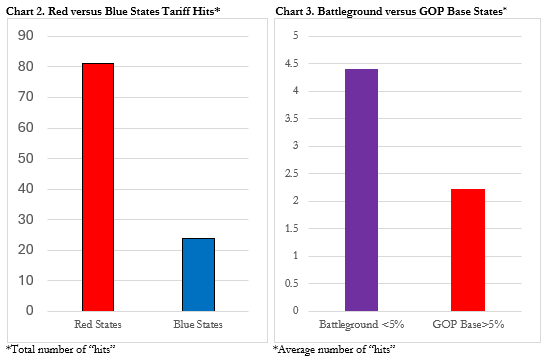
Third, the proposed Canadian tariff response appears to be even more finely calibrated within the group of states that Trump won in 2024. A comparison of states in which Trump won by more than 5 percent (“GOP base”) with states where the margin of victory was less than 5 percent (“Battleground”) reveals that the latter have double the average number of prospective “hits” than the former. There are far too few observations to draw firm statistical inferences. Nevertheless, to the extent that this difference could reflect a conscious effort to maximize political impact, with mid-term elections now less than two years away, the tacit message may be that Republicans running in states facing the biggest adjustment challenges from Canadian retaliation and that are most at risk of flipping should be working to limit the possible electoral damage. In short, convincing Trump that he has already won the tariff war and should refrain from further provocations would be in their political self-interest.
It is important to emphasize that each of these observations could simply be statistical artifacts generated by an incomplete assessment of the incidence of tariff “hits” or the limitations of AI. To repeat the caveat above: these observations reflect an unscientific sampling of the potential impacts of retaliatory Canadian tariffs; not a comprehensive analysis of each and every tariff line. That being said, although care should be exercised in making inferences from them, they appear to be consistent with a strategy to apply maximum political pressure on the White House while minimizing negative effects on Canadians.
At the same time, the admittedly naïve application of AI to identify states potentially at risk from retaliatory tariffs here could be deployed in real time during future trade negotiations to identify potential winners and losers. Such efforts would only be indicative of potential qualitative results, however, and could not possibly substitute for general equilibrium model-based quantitative projections. Nevertheless, they could advance negotiations by identifying potential political issues and the trade-offs that might be needed to secure a successful outcome.
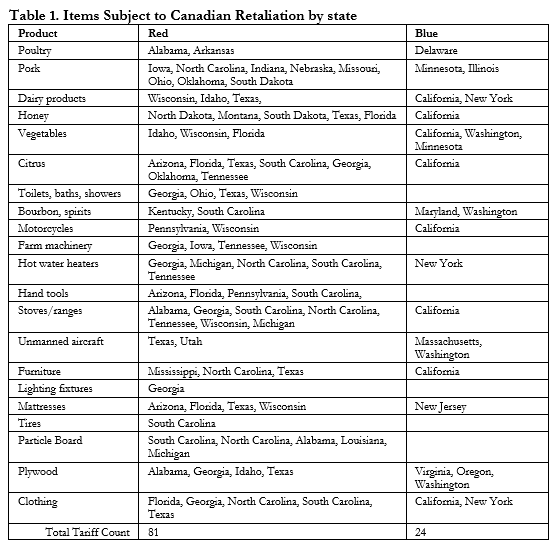
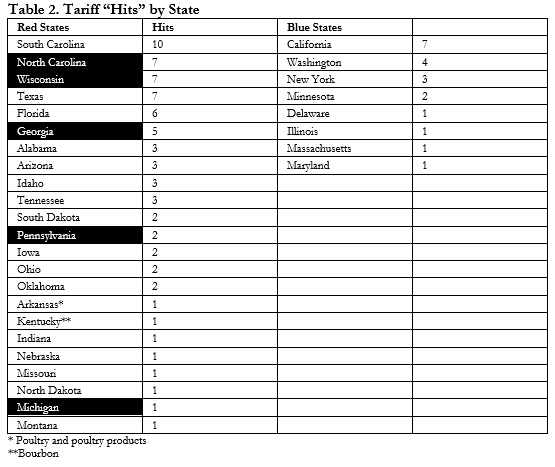
- Solidly blue California also has a high number of tariff “hits” (Table 2). This outcome is readily explained by the size and diversity of its economy, which increases its exposure to possible retaliation.
Author

Former IMF Director for Canada, Ireland, and the Caribbean

Canada Institute
The mission of the Wilson Center's Canada Institute is to raise the level of knowledge of Canada in the United States, particularly within the Washington, DC policy community. Research projects, initiatives, podcasts, and publications cover contemporary Canada, US-Canadian relations, North American political economy, and Canada's global role as it intersects with US national interests. Read more

Explore More
Browse Insights & Analysis
Understanding Trade Promotion Authority (TPA): Implications for US Trade

The Innovative Landscape of African Sovereign Wealth Funds

